Tips for Learners of Evidence-Based Medicine
Tips for Learners of Evidence-Based Medicine
Tips for Learners of Evidence-Based Medicine

You also want an ePaper? Increase the reach of your titles
YUMPU automatically turns print PDFs into web optimized ePapers that Google loves.
Montori et al<br />
though trial 2 shows a “positive” result (i.e., the confidence<br />
interval does not encompass zero), the sample size was inadequate<br />
and the result remains compatible with risk reductions<br />
below the minimal patient-important difference.<br />
When a study result is positive, you can determine<br />
whether the sample size was adequate by checking the lower<br />
boundary <strong>of</strong> the confidence interval, the smallest plausible<br />
treatment effect compatible with the results. If this value is<br />
greater than the smallest difference your patients would<br />
consider important, the sample size is adequate and the trial<br />
result definitive. However, if the lower boundary falls below<br />
the smallest patient-important difference, leaving patients<br />
uncertain as to whether taking the treatment is in their best<br />
interest, the trial is not definitive. The sample size is inadequate,<br />
and further trials are required.<br />
What happens when the confidence interval <strong>for</strong> the effect<br />
<strong>of</strong> a therapy includes zero (where zero means “no effect”<br />
and hence a negative result)?<br />
For studies with negative results — those that do not exclude<br />
a true treatment effect <strong>of</strong> zero — you must focus on<br />
the other end <strong>of</strong> the confidence interval, that representing<br />
the largest plausible treatment effect consistent with the<br />
trial data. You must consider whether the upper boundary<br />
<strong>of</strong> the confidence interval falls below the smallest difference<br />
that patients might consider important. If so, the sample<br />
size is adequate, and the trial is definitively negative (see<br />
trial 3 in Fig. 1C). Conversely, if the upper boundary exceeds<br />
the smallest patient-important difference, then the<br />
trial is not definitively negative, and more trials with larger<br />
sample sizes are needed (see trial 4 in Fig. 1C).<br />
The bottom line<br />
To determine whether a trial with a positive result is sufficiently<br />
large, clinicians should focus on the lower boundary <strong>of</strong><br />
the confidence interval and determine if it is greater than the<br />
smallest treatment benefit that patients would consider important<br />
enough to warrant taking the treatment. For studies<br />
with a negative result, clinicians should examine the upper<br />
boundary <strong>of</strong> the confidence interval to determine if this value<br />
is lower than the smallest treatment benefit that patients<br />
would consider important enough to warrant taking the treatment.<br />
In either case, if the confidence interval overlaps the<br />
smallest treatment benefit that is important to patients, then<br />
the study is not definitive and a larger study is needed.<br />
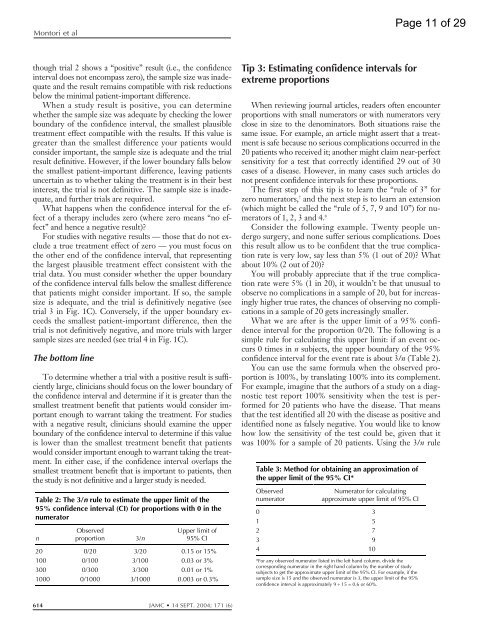
Table 2: The 3/n rule to estimate the upper limit <strong>of</strong> the<br />
95% confidence interval (CI) <strong>for</strong> proportions with 0 in the<br />
numerator<br />
n<br />
Observed<br />
proportion 3/n<br />
Upper limit <strong>of</strong><br />
95% CI<br />
20 0/20 3/20 0.15 or 15%<br />
100 0/100 3/100 0.03 or 3%<br />
300 0/300 3/300 0.01 or 1%<br />
1000 0/1000 3/1000 0.003 or 0.3%<br />
614 JAMC 14 SEPT. 2004; 171 (6)<br />
Tip 3: Estimating confidence intervals <strong>for</strong><br />
extreme proportions<br />
When reviewing journal articles, readers <strong>of</strong>ten encounter<br />
proportions with small numerators or with numerators very<br />
close in size to the denominators. Both situations raise the<br />
same issue. For example, an article might assert that a treatment<br />
is safe because no serious complications occurred in the<br />
20 patients who received it; another might claim near-perfect<br />
sensitivity <strong>for</strong> a test that correctly identified 29 out <strong>of</strong> 30<br />
cases <strong>of</strong> a disease. However, in many cases such articles do<br />
not present confidence intervals <strong>for</strong> these proportions.<br />
The first step <strong>of</strong> this tip is to learn the “rule <strong>of</strong> 3” <strong>for</strong><br />
zero numerators, 7 and the next step is to learn an extension<br />
(which might be called the “rule <strong>of</strong> 5, 7, 9 and 10”) <strong>for</strong> numerators<br />
<strong>of</strong> 1, 2, 3 and 4. 8<br />
Consider the following example. Twenty people undergo<br />
surgery, and none suffer serious complications. Does<br />
this result allow us to be confident that the true complication<br />
rate is very low, say less than 5% (1 out <strong>of</strong> 20)? What<br />
about 10% (2 out <strong>of</strong> 20)?<br />
You will probably appreciate that if the true complication<br />
rate were 5% (1 in 20), it wouldn’t be that unusual to<br />
observe no complications in a sample <strong>of</strong> 20, but <strong>for</strong> increasingly<br />
higher true rates, the chances <strong>of</strong> observing no complications<br />
in a sample <strong>of</strong> 20 gets increasingly smaller.<br />
What we are after is the upper limit <strong>of</strong> a 95% confidence<br />
interval <strong>for</strong> the proportion 0/20. The following is a<br />
simple rule <strong>for</strong> calculating this upper limit: if an event occurs<br />
0 times in n subjects, the upper boundary <strong>of</strong> the 95%<br />
confidence interval <strong>for</strong> the event rate is about 3/n (Table 2).<br />
You can use the same <strong>for</strong>mula when the observed proportion<br />
is 100%, by translating 100% into its complement.<br />
For example, imagine that the authors <strong>of</strong> a study on a diagnostic<br />
test report 100% sensitivity when the test is per<strong>for</strong>med<br />
<strong>for</strong> 20 patients who have the disease. That means<br />
that the test identified all 20 with the disease as positive and<br />
identified none as falsely negative. You would like to know<br />
how low the sensitivity <strong>of</strong> the test could be, given that it<br />
was 100% <strong>for</strong> a sample <strong>of</strong> 20 patients. Using the 3/n rule<br />
Table 3: Method <strong>for</strong> obtaining an approximation <strong>of</strong><br />
the upper limit <strong>of</strong> the 95% CI*<br />
Observed<br />
numerator<br />
Numerator <strong>for</strong> calculating<br />
approximate upper limit <strong>of</strong> 95% CI<br />
0 3<br />
1 5<br />
2 7<br />
3 9<br />
4 10<br />
*For any observed numerator listed in the left hand column, divide the<br />
corresponding numerator in the right hand column by the number <strong>of</strong> study<br />
subjects to get the approximate upper limit <strong>of</strong> the 95% CI. For example, if the<br />
sample size is 15 and the observed numerator is 3, the upper limit <strong>of</strong> the 95%<br />
confidence interval is approximately 9 ÷ 15 = 0.6 or 60%.<br />
Page 11 <strong>of</strong> 29