Tips for Learners of Evidence-Based Medicine
Tips for Learners of Evidence-Based Medicine
Tips for Learners of Evidence-Based Medicine

Create successful ePaper yourself
Turn your PDF publications into a flip-book with our unique Google optimized e-Paper software.
Montori et al<br />
8 patients, and the largest enrolled 2000 patients, and half<br />
<strong>of</strong> the patients in each trial underwent the experimental<br />
treatment. Now imagine that all <strong>of</strong> the trials showed a relative<br />
risk reduction <strong>for</strong> the treatment group <strong>of</strong> 50% (meaning<br />
that patients in the drug treatment group were only half<br />
as likely as those in the placebo group to have a stroke). In<br />
each individual trial, how confident can we be that the true<br />
value <strong>of</strong> the relative risk reduction is important <strong>for</strong> patients<br />
(i.e., “patient-important”)? 5 If you were to look at the studies<br />
individually, which ones would lead you to recommend<br />
the treatment unequivocally to your patients?<br />
Most clinicians might intuitively guess that we could be<br />
more confident in the results <strong>of</strong> the larger trials. Why is this?<br />
In the absence <strong>of</strong> bias or systematic error, the results <strong>of</strong> a trial<br />
can be interpreted as an estimate <strong>of</strong> the true magnitude <strong>of</strong> effect<br />
that would occur if all possible eligible patients had been<br />
included. When only a few <strong>of</strong> these patients are included, the<br />
play <strong>of</strong> chance alone may lead to a result that is quite different<br />
from the true value. Confidence intervals are a numeric<br />
measure <strong>of</strong> the range within which such variation is likely to<br />
occur. The 95% confidence intervals that we <strong>of</strong>ten see in<br />
biomedical publications represent the range within which we<br />
are likely to find the underlying true treatment effect.<br />
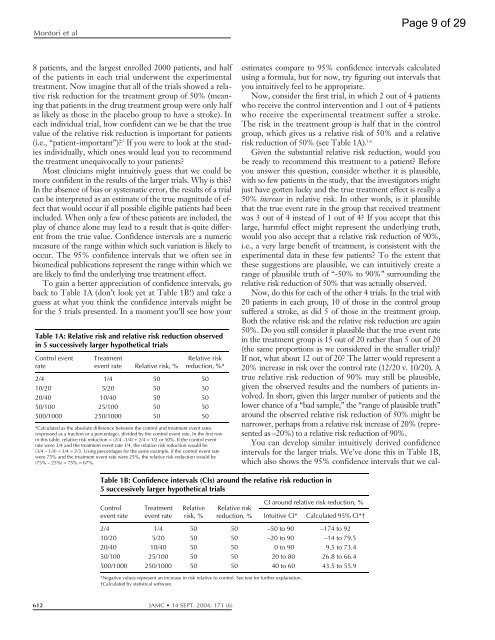
To gain a better appreciation <strong>of</strong> confidence intervals, go<br />
back to Table 1A (don’t look yet at Table 1B!) and take a<br />
guess at what you think the confidence intervals might be<br />
<strong>for</strong> the 5 trials presented. In a moment you’ll see how your<br />
Table 1A: Relative risk and relative risk reduction observed<br />
in 5 successively larger hypothetical trials<br />
Control event<br />
rate<br />
Treatment<br />
event rate Relative risk, %<br />
Relative risk<br />
reduction, %*<br />
2/4 1/4 50 50<br />
10/20 5/20 50 50<br />
20/40 10/40 50 50<br />
50/100 25/100 50 50<br />
500/1000 250/1000 50 50<br />
*Calculated as the absolute difference between the control and treatment event rates<br />
(expressed as a fraction or a percentage), divided by the control event rate. In the first row<br />
in this table, relative risk reduction = (2/4 –1/4) ÷ 2/4 = 1/2 or 50%. If the control event<br />
rate were 3/4 and the treatment event rate 1/4, the relative risk reduction would be<br />
(3/4 – 1/4) ÷ 3/4 = 2/3. Using percentages <strong>for</strong> the same example, if the control event rate<br />
were 75% and the treatment event rate were 25%, the relative risk reduction would be<br />
(75% – 25%) ÷ 75% = 67%.<br />
Table 1B: Confidence intervals (CIs) around the relative risk reduction in<br />
5 successively larger hypothetical trials<br />
Control<br />
event rate<br />
Treatment<br />
event rate<br />
Relative<br />
risk, %<br />
612 JAMC 14 SEPT. 2004; 171 (6)<br />
estimates compare to 95% confidence intervals calculated<br />
using a <strong>for</strong>mula, but <strong>for</strong> now, try figuring out intervals that<br />
you intuitively feel to be appropriate.<br />
Now, consider the first trial, in which 2 out <strong>of</strong> 4 patients<br />
who receive the control intervention and 1 out <strong>of</strong> 4 patients<br />
who receive the experimental treatment suffer a stroke.<br />
The risk in the treatment group is half that in the control<br />
group, which gives us a relative risk <strong>of</strong> 50% and a relative<br />
risk reduction <strong>of</strong> 50% (see Table 1A). 1,6<br />
Given the substantial relative risk reduction, would you<br />
be ready to recommend this treatment to a patient? Be<strong>for</strong>e<br />
you answer this question, consider whether it is plausible,<br />
with so few patients in the study, that the investigators might<br />
just have gotten lucky and the true treatment effect is really a<br />
50% increase in relative risk. In other words, is it plausible<br />
that the true event rate in the group that received treatment<br />
was 3 out <strong>of</strong> 4 instead <strong>of</strong> 1 out <strong>of</strong> 4? If you accept that this<br />
large, harmful effect might represent the underlying truth,<br />
would you also accept that a relative risk reduction <strong>of</strong> 90%,<br />
i.e., a very large benefit <strong>of</strong> treatment, is consistent with the<br />
experimental data in these few patients? To the extent that<br />
these suggestions are plausible, we can intuitively create a<br />
range <strong>of</strong> plausible truth <strong>of</strong> “-50% to 90%” surrounding the<br />
relative risk reduction <strong>of</strong> 50% that was actually observed.<br />
Now, do this <strong>for</strong> each <strong>of</strong> the other 4 trials. In the trial with<br />
20 patients in each group, 10 <strong>of</strong> those in the control group<br />
suffered a stroke, as did 5 <strong>of</strong> those in the treatment group.<br />
Both the relative risk and the relative risk reduction are again<br />
50%. Do you still consider it plausible that the true event rate<br />
in the treatment group is 15 out <strong>of</strong> 20 rather than 5 out <strong>of</strong> 20<br />
(the same proportions as we considered in the smaller trial)?<br />
If not, what about 12 out <strong>of</strong> 20? The latter would represent a<br />
20% increase in risk over the control rate (12/20 v. 10/20). A<br />
true relative risk reduction <strong>of</strong> 90% may still be plausible,<br />
given the observed results and the numbers <strong>of</strong> patients involved.<br />
In short, given this larger number <strong>of</strong> patients and the<br />
lower chance <strong>of</strong> a “bad sample,” the “range <strong>of</strong> plausible truth”<br />
around the observed relative risk reduction <strong>of</strong> 50% might be<br />
narrower, perhaps from a relative risk increase <strong>of</strong> 20% (represented<br />
as –20%) to a relative risk reduction <strong>of</strong> 90%.<br />
You can develop similar intuitively derived confidence<br />
intervals <strong>for</strong> the larger trials. We’ve done this in Table 1B,<br />
which also shows the 95% confidence intervals that we cal-<br />
CI around relative risk reduction, %<br />
Relative risk<br />
reduction, % Intuitive CI* Calculated 95% CI*†<br />
2/4 1/4 50 50 –50 to 90 –174 to 92<br />
10/20 5/20 50 50 –20 to 90 –14 to 79.5<br />
20/40 10/40 50 50 0 to 90 9.5 to 73.4<br />
50/100 25/100 50 50 20 to 80 26.8 to 66.4<br />
500/1000 250/1000 50 50 40 to 60 43.5 to 55.9<br />
*Negative values represent an increase in risk relative to control. See text <strong>for</strong> further explanation.<br />
†Calculated by statistical s<strong>of</strong>tware.<br />
Page 9 <strong>of</strong> 29