CMAJ 1995 Basic Statistics for Clinicians
CMAJ 1995 Basic Statistics for Clinicians
CMAJ 1995 Basic Statistics for Clinicians

Create successful ePaper yourself
Turn your PDF publications into a flip-book with our unique Google optimized e-Paper software.
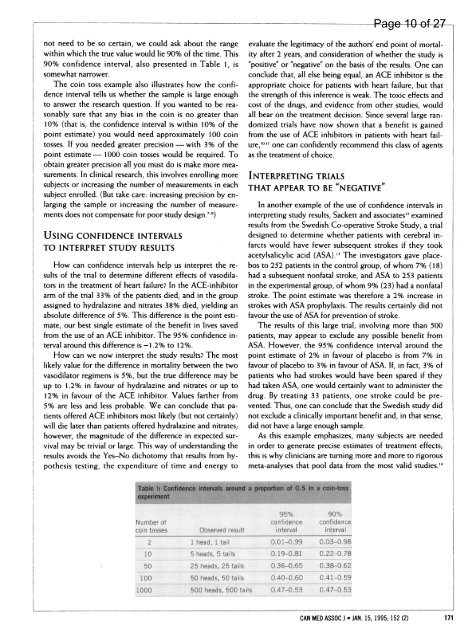
not need to be so certain, we could ask about the range<br />
within which the true value would lie 90% of the time. This<br />
90% confidence interval, also presented in Table 1, is<br />
somewhat narrower.<br />
The coin toss example also illustrates how the confidence<br />
interval tells us whether the sample is large enough<br />
to answer the research question. If you wanted to be reasonably<br />
sure that any bias in the coin is no greater than<br />
10% (that is, the confidence interval is within 10% of the<br />
point estimate) you would need approximately 100 coin<br />
tosses. If you needed greater precision- with 3% of the<br />
point estimate - 1000 coin tosses would be required. To<br />
obtain greater precision all you must do is make more measurements.<br />
In clinical research, this involves enrolling more<br />
subjects or increasing the number of measurements in each<br />
subject enrolled. (But take care: increasing precision by enlarging<br />
the sample or increasing the number of measurements<br />
does not compensate <strong>for</strong> poor study design.'-9)<br />
USING CONFIDENCE INTERVALS<br />
TO INTERPRET STUDY RESULTS<br />
How can confidence intervals help us interpret the results<br />
of the trial to determine different effects of vasodilators<br />
in the treatment of heart failure? In the ACE-inhibitor<br />
arm of the trial 33% of the patients died, and in the group<br />
assigned to hydralazine and nitrates 38% died, yielding an<br />
absolute difference of 5%. This difference is the point estimate,<br />
our best single estimate of the benefit in lives saved<br />
from the use of an ACE inhibitor. The 95% confidence interval<br />
around this difference is -1.2% to 12%.<br />
How can we now interpret the study results? The most<br />
likely value <strong>for</strong> the difference in mortality between the two<br />
vasodilator regimens is 5%, but the true difference may be<br />
up to 1.2% in favour of hydralazine and nitrates or up to<br />
12% in favour of the ACE inhibitor. Values farther from<br />
5% are less and less probable. We can conclude that patients<br />
offered ACE inhibitors most likely (but not certainly)<br />
will die later than patients offered hydralazine and nitrates;<br />
however, the magnitude of the difference in expected survival<br />
may be trivial or large. This way of understanding the<br />
results avoids the Yes-No dichotomy that results from hypothesis<br />
testing, the expenditure of time and energy to<br />
evaluate the legitimacy of the authors' end point of mortality<br />
after 2 years, and consideration of whether the study is<br />
"positive" or "negative" on the basis of the results. One can<br />
conclude that, all else being equal, an ACE inhibitor is the<br />
appropriate choice <strong>for</strong> patients with heart failure, but that<br />
the strength of this inference is weak. The toxic effects and<br />
cost of the drugs, and evidence from other studies, would<br />
all bear on the treatment decision. Since several large randomized<br />
trials have now shown that a benefit is gained<br />
from the use of ACE inhibitors in patients with heart failure,'°"<br />
one can confidently recommend this class of agents<br />
as the treatment of choice.<br />
INTERPRETING TRIALS<br />
THAT APPEAR TO BE "NEGATIVE"<br />
In another example of the use of confidence intervals in<br />
interpreting study results, Sackett and associates'2 examined<br />
results from the Swedish Co-operative Stroke Study, a trial<br />
designed to determine whether patients with cerebral infarcts<br />
would have fewer subsequent strokes if they took<br />
acetylsalicylic acid (ASA).,, The investigators gave placebos<br />
to 252 patients in the control group, of whom 7% (18)<br />
had a subsequent nonfatal stroke, and ASA to 253 patients<br />
in the experimental group, of whom 9% (23) had a nonfatal<br />
stroke. The point estimate was there<strong>for</strong>e a 2% increase in<br />
strokes with ASA prophylaxis. The results certainly did not<br />
favour the use of ASA <strong>for</strong> prevention of stroke.<br />
The results of this large trial, involving more than 500<br />
patients, may appear to exclude any possible benefit from<br />
ASA. However, the 95% confidence interval around the<br />
point estimate of 2% in favour of placebo is from 7% in<br />
favour of placebo to 3% in favour of ASA. If, in fact, 3% of<br />
patients who had strokes would have been spared if they<br />
had taken ASA, one would certainly want to administer the<br />
drug. By treating 33 patients, one stroke could be prevented.<br />
Thus, one can conclude that the Swedish study did<br />
not exclude a clinically important benefit and, in that sense,<br />
did not have a large enough sample.<br />
As this example emphasizes, many subjects are needed<br />
in order to generate precise estimates of treatment effects;<br />
this is why clinicians are turning more and more to rigorous<br />
meta-analyses that pool data from the most valid studies.'4<br />
Table Il Confidence Intevas around a proportion of 0.5 in a coin-toss<br />
expenrment<br />
Number of<br />
coin tosses Observed result<br />
2<br />
1 head, 1 tall<br />
10<br />
5 heads, 5 tails<br />
50<br />
25 heads, 25 tails<br />
100<br />
50 heads, 50 tails<br />
1000<br />
500 heads, 500 tails<br />
95%<br />
confidence<br />
interval<br />
90%<br />
confidence<br />
interval<br />
0.01-0.99 0.03-0.98<br />
0.19-0.81 0.22-0.78<br />
0.36-0.65 0.38-0.62<br />
0.40-0.60 0.41-0.59<br />
0.47-0.53 0.47-0.53<br />
Page 10 of 27<br />
CAN MED ASSOC J * JAN. 15, <strong>1995</strong>; 152 (2) 171