CMAJ 1995 Basic Statistics for Clinicians
CMAJ 1995 Basic Statistics for Clinicians
CMAJ 1995 Basic Statistics for Clinicians

You also want an ePaper? Increase the reach of your titles
YUMPU automatically turns print PDFs into web optimized ePapers that Google loves.
versa. However, if we assume that the walk test provides a<br />
good indication of exercise capacity in day-to-day life, the<br />
moderately strong correlation suggests that the result of the<br />
cycle ergometer test also tells us something, although not<br />
as much, about day-to-day exercise capacity.<br />
You will often see a p value provided with a correlation<br />
coefficient (the first article in this series discusses the interpretation<br />
of p values). This p value is determined from a hypothesis<br />
test, with the null hypothesis being that the true<br />
correlation between the two measures is 0. Thus, the p<br />
value represents the probability that, if the true correlation<br />
were 0, a relation as strong as or stronger than the one we<br />
actually observed would have occurred by chance. The<br />
smaller the p value, the less likely it is that chance explains<br />
the apparent relation between the two measures.<br />
The p value depends not only on the strength of the relation<br />
but also on the sample size. In this case, we had data<br />
on the results of the walk test and the cycle ergometer test<br />
from 179 patients and a correlation coefficient of 0.5,<br />
which yields a p value of less than 0.0001. A relation can be<br />
very weak, but if the sample is large enough the p value<br />
may be small. For instance, with a sample of 500, we reach<br />
the conventional threshold <strong>for</strong> statistical significance (p =<br />
0.05) when the correlation coefficient is only 0. 10.<br />
In a previous article in this series we pointed out that, in<br />
evaluating treatment effects, the size of the effect and the<br />
confidence interval tend to be much more in<strong>for</strong>mative than<br />
p values. The same is true of correlations: the magnitude of<br />
the correlation and the confidence interval are the key values.<br />
The 95% confidence interval <strong>for</strong> the correlation be-<br />
35<br />
30 -<br />
U)M 25-<br />
~20-<br />
0<br />
15<br />
5<br />
0<br />
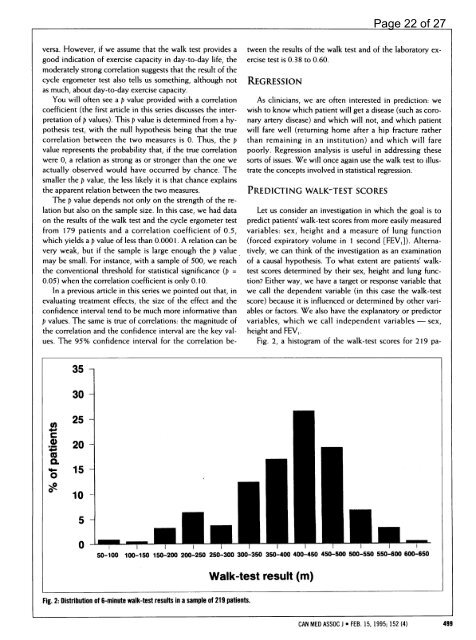
Fig. 2: Distribution of 6-minute walk-test results in a sample of 219 patients.<br />
tween the results of the walk test and of the laboratory exercise<br />
test is 0.38 to 0.60.<br />
REGRESSION<br />
As clinicians, we are often interested in prediction: we<br />
wish to know which patient will get a disease (such as coronary<br />
artery disease) and which will not, and which patient<br />
will fare well (returning home after a hip fracture rather<br />
than remaining in an institution) and which will fare<br />
poorly. Regression analysis is useful in addressing these<br />
sorts of issues. We will once again use the walk test to illustrate<br />
the concepts involved in statistical regression.<br />
PREDICTING WALK-TEST SCORES<br />
Let us consider an investigation in which the goal is to<br />
predict patients' walk-test scores from more easily measured<br />
variables: sex, height and a measure of lung function<br />
(<strong>for</strong>ced expiratory volume in I second [FEV]). Alternatively,<br />
we can think of the investigation as an examination<br />
of a causal hypothesis. To what extent are patients' walktest<br />
scores determined by their sex, height and lung function?<br />
Either way, we have a target or response variable that<br />
we call the dependent variable (in this case the walk-test<br />
score) because it is influenced or determined by other variables<br />
or factors. We also have the explanatory or predictor<br />
variables, which we call independent variables - sex,<br />
height and FEVy.<br />
Fig. 2, a histogram of the walk-test scores <strong>for</strong> 219 pa-<br />
50-100 100-150 150-200 200-250 250-300 300-350 350-400 400-450 450-500 500-550 550-600 600-650<br />
Walk-test result (m)<br />
Page 22 of 27<br />
CAN MED ASSOC J * FEB. 15, <strong>1995</strong>; 152 (4) 499