CMAJ 1995 Basic Statistics for Clinicians
CMAJ 1995 Basic Statistics for Clinicians
CMAJ 1995 Basic Statistics for Clinicians

You also want an ePaper? Increase the reach of your titles
YUMPU automatically turns print PDFs into web optimized ePapers that Google loves.
tients with long-term lung disease, shows that these scores<br />
vary widely. If we had to predict an individual patient's<br />
walk-test score without any other in<strong>for</strong>mation, our best<br />
guess would be the mean score <strong>for</strong> all patients (394 m). For<br />
many patients, however, this prediction would be well off<br />
the mark.<br />
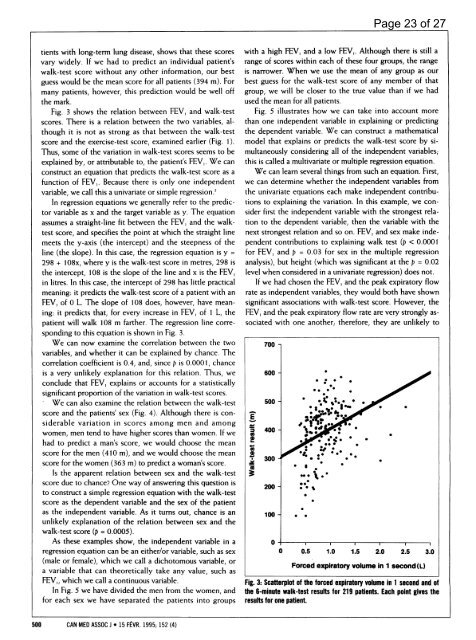
Fig. 3 shows the relation between FEV, and walk-test<br />
scores. There is a relation between the two variables, although<br />
it is not as strong as that between the walk-test<br />
score and the exercise-test score, examined earlier (Fig. 1).<br />
Thus, some of the variation in walk-test scores seems to be<br />
explained by, or attributable to, the patient's FEV,. We can<br />
construct an equation that predicts the walk-test score as a<br />
function of FEV,. Because there is only one independent<br />
variable, we call this a univariate or simple regression.5<br />
In regression equations we generally refer to the predictor<br />
variable as x and the target variable as y. The equation<br />
assumes a straight-line fit between the FEV, and the walktest<br />
score, and specifies the point at which the straight line<br />
meets the y-axis (the intercept) and the steepness of the<br />
line (the slope). In this case, the regression equation is y =<br />
298 + 108x, where y is the walk-test score in metres, 298 is<br />
the intercept, 108 is the slope of the line and x is the FEV,<br />
in litres. In this case, the intercept of 298 has little practical<br />
meaning: it predicts the walk-test score of a patient with an<br />
FEV, of 0 L. The slope of 108 does, however, have meaning:<br />
it predicts that, <strong>for</strong> every increase in FEV, of I L, the<br />
patient will walk 108 m farther. The regression line corresponding<br />
to this equation is shown in Fig. 3.<br />
We can now examine the correlation between the two<br />
variables, and whether it can be explained by chance. The<br />
correlation coefficient is 0.4, and, since p is 0.0001, chance<br />
is a very unlikely explanation <strong>for</strong> this relation. Thus, we<br />
conclude that FEV, explains or accounts <strong>for</strong> a statistically<br />
significant proportion of the variation in walk-test scores.<br />
We can also examine the relation between the walk-test<br />
score and the patients' sex (Fig. 4). Although there is considerable<br />
variation in scores among men and among<br />
women, men tend to have higher scores than women. If we<br />
had to predict a man's score, we would choose the mean<br />
score <strong>for</strong> the men (410 m), and we would choose the mean<br />
score <strong>for</strong> the women (363 m) to predict a woman's score.<br />
Is the apparent relation between sex and the walk-test<br />
score due to chance? One way of answering this question is<br />
to construct a simple regression equation with the walk-test<br />
score as the dependent variable and the sex of the patient<br />
as the independent variable. As it turns out, chance is an<br />
unlikely explanation of the relation between sex and the<br />
walk-test score (p = 0.0005).<br />
As these examples show, the independent variable in a<br />
regression equation can be an either/or variable, such as sex<br />
(male or female), which we call a dichotomous variable, or<br />
a variable that can theoretically take any value, such as<br />
FEV,, which we call a continuous variable.<br />
In Fig. 5 we have divided the men from the women, and<br />
<strong>for</strong> each sex we have separated the patients into groups<br />
500 CAN MED ASSOC J * 15 FtVR. <strong>1995</strong>; 152 (4)<br />
with a high FEV, and a low FEVI. Although there is still a<br />
range of scores within each of these four groups, the range<br />
is narrower. When we use the mean of any group as our<br />
best guess <strong>for</strong> the walk-test score of any member of that<br />
group, we will be closer to the true value than if we had<br />
used the mean <strong>for</strong> all patients.<br />
Fig. 5 illustrates how we can take into account more<br />
than one independent variable in explaining or predicting<br />
the dependent variable. We can construct a mathematical<br />
model that explains or predicts the walk-test score by simultaneously<br />
considering all of the independent variables;<br />
this is called a multivariate or multiple regression equation.<br />
We can learn several things from such an equation. First,<br />
we can determine whether the independent variables from<br />
the univariate equations each make independent contributions<br />
to explaining the variation. In this example, we consider<br />
first the independent variable with the strongest relation<br />
to the dependent variable, then the variable with the<br />
next strongest relation and so on. FEV, and sex make independent<br />
contributions to explaining walk test (p < 0.0001<br />
<strong>for</strong> FEV, and p = 0.03 <strong>for</strong> sex in the multiple regression<br />
analysis), but height (which was significant at the p = 0.02<br />
level when considered in a univariate regression) does not.<br />
If we had chosen the FEV, and the peak expiratory flow<br />
rate as independent variables, they would both have shown<br />
significant associations with walk-test score. However, the<br />
FEVI and the peak expiratory flow rate are very strongly associated<br />
with one another; there<strong>for</strong>e, they are unlikely to<br />
700 -<br />
600-<br />
500<br />
200 - :<br />
100 - ..<br />
Page 23 of 27<br />
0 0 0.5 1.0 1.5 2.0 2.5 3.0<br />
Forced expiratory volume in 1 second(L)<br />
Fig. 3: Scatterplot of the <strong>for</strong>ced expiratory volume in 1 second and of<br />
the 6-minute walk-test results <strong>for</strong> 219 patients. Each point gives the<br />
results <strong>for</strong> one patient.