CMAJ 1995 Basic Statistics for Clinicians
CMAJ 1995 Basic Statistics for Clinicians
CMAJ 1995 Basic Statistics for Clinicians

You also want an ePaper? Increase the reach of your titles
YUMPU automatically turns print PDFs into web optimized ePapers that Google loves.
such as blood pressure between groups, or the same risk<br />
of an adverse event such as death in both groups. Alternatively,<br />
the trial results may show a decreased risk of<br />
adverse outcomes in patients receiving the experimental<br />
treatment. In a study examining a putatively harmful agent<br />
there may be no increase in risk among patients in a group<br />
exposed to the agent in comparison with those in a control<br />
group or an association between exposure and an adverse<br />
event, which suggests that the agent is indeed harmful. In<br />
this article, we examine how one can express the magnitude<br />
of these associations.<br />
When investigators present results that show a difference<br />
in the mean value of a clinical measurement between<br />
two groups, the interpretation is usually straight<strong>for</strong>ward.<br />
However, when they present results that show the proportion<br />
of patients who suffered an adverse event in each<br />
group, interpretation may be more difficult. In this situation<br />
they may express the strength of the association as a relative<br />
risk, an absolute risk reduction or an odds ratio. Understanding<br />
these measures is challenging and important; they<br />
will provide the focus of this article. We will examine the<br />
relative merits of the different measures of association and<br />
show how they can lead clinicians to different conclusions.<br />
INTRODUCING THE 2 x 2 TABLE<br />
A crucial concept in analysing the efficacy of therapeutic<br />
interventions is the "event." Analysis often examines the<br />
proportion of patients who suffered a particular outcome<br />
(the "event") in the treatment and control groups. This is always<br />
true when the outcome is clearly a dichotomous variable<br />
that is, a discrete event that either occurs or does<br />
not occur. Examples of dichotomous outcomes are the occurrence<br />
of negative events, such as stroke, myocardial infarction,<br />
death or recurrence of cancer, or positive events,<br />
such as ulcer healing or resolution of symptoms. Not only<br />
an event's occurrence but also its timing may be important.<br />
We will return to this issue later.<br />
Even if the results are not of a yes-or-no <strong>for</strong>m, investigators<br />
sometimes choose to present them as if they were. Investigators<br />
may present variables such as duration of exercise<br />
be<strong>for</strong>e chest pain develops, number of episodes of<br />
angina per month, change in lung function or number of<br />
visits to the emergency room as mean values in each of the<br />
two groups. However, they may also trans<strong>for</strong>m these values<br />
into dichotomous data by specifying a threshold or degree<br />
of change that constitutes an important improvement or<br />
Table 1: Sample 2 x 2 table<br />
352 CAN MED ASSOC J * ler FEVR. <strong>1995</strong>; 152 (3)<br />
deterioration and then examining the proportion of patients<br />
above and below this threshold. For example, investigators<br />
in one study used <strong>for</strong>ced expiratory volume in 1 second<br />
(FEV,) to assess the efficacy of therapy with<br />
corticosteroids taken orally by patients with a chronic stable<br />
airflow limitation; they defined an "event" as an improvement<br />
in FEV, of more than 20% over the baseline<br />
value.2<br />
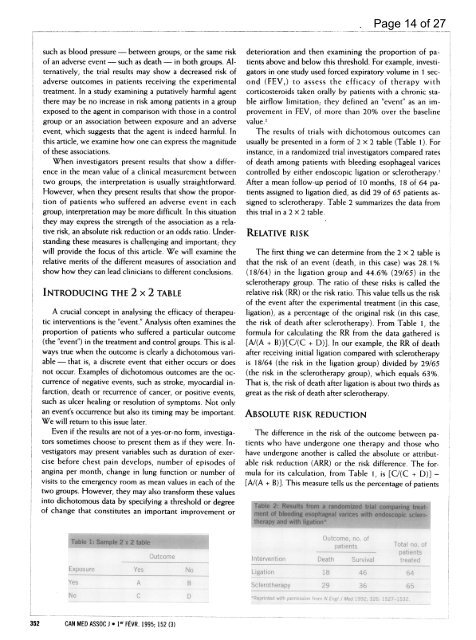
The results of trials with dichotomous outcomes can<br />
usually be presented in a <strong>for</strong>m of 2 x 2 table (Table 1). For<br />
instance, in a randomized trial investigators compared rates<br />
of death among patients with bleeding esophageal varices<br />
controlled by either endoscopic ligation or sclerotherapy.3<br />
After a mean follow-up period of 10 months, 18 of 64 patients<br />
assigned to ligation died, as did 29 of 65 patients assigned<br />
to sclerotherapy. Table 2 summarizes the data from<br />
this trial in a 2 x 2 table.<br />
RELATIVE RISK<br />
The first thing we can determine from the 2 x 2 table is<br />
that the risk of an event (death, in this case) was 28.1 %<br />
(18/64) in the ligation group and 44.6% (29/65) in the<br />
sclerotherapy group. The ratio of these risks is called the<br />
relative risk (RR) or the risk ratio. This value tells us the risk<br />
of the event after the experimental treatment (in this case,<br />
ligation), as a percentage of the original risk (in this case,<br />
the risk of death after sclerotherapy). From Table 1, the<br />
<strong>for</strong>mula <strong>for</strong> calculating the RR from the data gathered is<br />
[A/(A + B)]/[C/(C + D)]. In our example, the RR of death<br />
after receiving initial ligation compared with sclerotherapy<br />
is 18/64 (the risk in the ligation group) divided by 29/65<br />
(the risk in the sclerotherapy group), which equals 63%.<br />
That is, the risk of death after ligation is about two thirds as<br />
great as the risk of death after sclerotherapy.<br />
ABSOLUTE RISK REDUCTION<br />
Page 14 of 27<br />
The difference in the risk of the outcome between patients<br />
who have undergone one therapy and those who<br />
have undergone another is called the absolute or attributable<br />
risk reduction (ARR) or the risk difference. The <strong>for</strong>mula<br />
<strong>for</strong> its calculation, from Table 1, is [C/(C + D)] -<br />
[A/(A + B)]. This measure tells us the percentage of patients<br />
Table 2: Results from a randomized trial comparing treatment<br />
of bleeding esophageal varices with endoscopic scierotherapy<br />
and with ligation*