CMAJ 1995 Basic Statistics for Clinicians
CMAJ 1995 Basic Statistics for Clinicians
CMAJ 1995 Basic Statistics for Clinicians

You also want an ePaper? Increase the reach of your titles
YUMPU automatically turns print PDFs into web optimized ePapers that Google loves.
In the case of ASA prophylaxis <strong>for</strong> recurrent stroke, such a<br />
meta-analysis showed that antiplatelet agents given to patients<br />
with a previous transient ischemic attack (TIA) or<br />
stroke reduced the risk of a subsequent TIA or stroke by<br />
approximately 25% (confidence interval approximately<br />
19% to 31%). This benefit is great enough that most clinicians<br />
will want to treat such patients with ASA.'5<br />
This example also illustrates that, when one sees results<br />
of an apparently "negative" trial (one that, in a hypothesistesting<br />
framework, would fail to exclude the null hypothesis),<br />
one should pay particular attention to the upper end of<br />
the confidence interval, that is, the end that suggests the<br />
largest benefit from treatment. If even the smallest benefit<br />
of clinical importance lies above the upper boundary of the<br />
confidence interval, the trial is definitively negative. In contrast,<br />
if clinically important benefits fall within the confidence<br />
interval, the trial has not ruled out the possibility<br />
that the treatment is worth while.<br />
INTERPRETING TRIALS<br />
THAT APPEAR TO BE POSITIVE"<br />
How can confidence intervals provide in<strong>for</strong>mation about<br />
the results of a "positive" trial results that, in the previous<br />
hypothesis-testing framework, would be definitive enough to<br />
exclude chance as the explanation <strong>for</strong> differences between<br />
results of treatments? In another double-blind randomized<br />
trial of treatments <strong>for</strong> heart failure, the effect of enalapril was<br />
compared with that of a placebo." Of 1285 patients randomly<br />
assigned to receive the ACE inhibitor, 48% (613)<br />
died or were admitted to hospital <strong>for</strong> worsening heart failure,<br />
whereas 57% (736/1284) of patients who received placebo<br />
died or required hospital care. The point estimate of the difference<br />
in death or hospital admission <strong>for</strong> heart failure was<br />
10%, and the 95% confidence interval was 6% to 14%.<br />
Thus, the smallest true effect of the ACE inhibitor that is<br />
compatible with the data is a 6% (or about 1 in 17) reduction<br />
in the number of patients with these adverse outcomes. If it is<br />
considered worth while to treat 17 patients in order to prevent<br />
one death or heart failure, this trial is definitive. If, be<strong>for</strong>e<br />
using a drug, you require a reduction of more than 6%<br />
in the proportion of patients who are spared death or heart<br />
failure, a larger trial (with a correspondingly narrower confidence<br />
interval) would be required.<br />
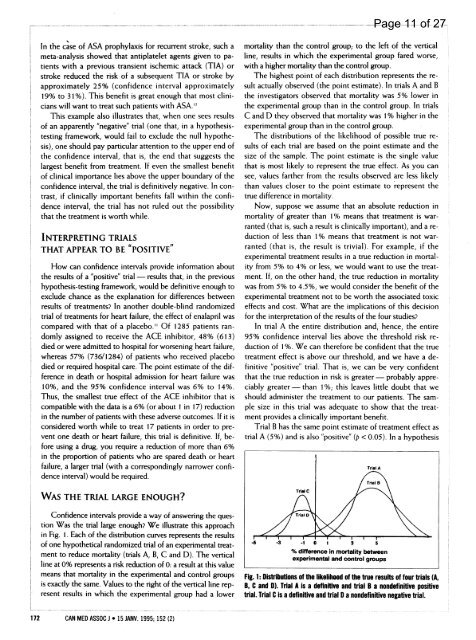
WAS THE TRIAL LARGE ENOUGH?<br />
Confidence intervals provide a way of answering the question<br />
Was the trial large enough? We illustrate this approach<br />
in Fig. 1. Each of the distribution curves represents the results<br />
of one hypothetical randomized trial of an experimental treatment<br />
to reduce mortality (trials A, B, C and D). The vertical<br />
line at 0% represents a risk reduction of 0: a result at this value<br />
means that mortality in the experimental and control groups<br />
is exactly the same. Values to the right of the vertical line represent<br />
results in which the experimental group had a lower<br />
172 CAN MED ASSOC J * 15 JANV. <strong>1995</strong>; 152 (2)<br />
mortality than the control group; to the left of the vertical<br />
line, results in which the experimental group fared worse,<br />
with a higher mortality than the control group.<br />
The highest point of each distribution represents the result<br />
actually observed (the point estimate). In trials A and B<br />
the investigators observed that mortality was 5% lower in<br />
the experimental group than in the control group. In trials<br />
C and D they observed that mortality was 1% higher in the<br />
experimental group than in the control group.<br />
The distributions of the likelihood of possible true results<br />
of each trial are based on the point estimate and the<br />
size of the sample. The point estimate is the single value<br />
that is most likely to represent the true effect. As you can<br />
see, values farther from the results observed are less likely<br />
than values closer to the point estimate to represent the<br />
true difference in mortality.<br />
Now, suppose we assume that an absolute reduction in<br />
mortality of greater than 1% means that treatment is warranted<br />
(that is, such a result is clinically important), and a reduction<br />
of less than 1% means that treatment is not warranted<br />
(that is, the result is trivial). For example, if the<br />
experimental treatment results in a true reduction in mortality<br />
from 5% to 4% or less, we would want to use the treatment.<br />
If, on the other hand, the true reduction in mortality<br />
was from 5% to 4.5%, we would consider the benefit of the<br />
experimental treatment not to be worth the associated toxic<br />
effects and cost. What are the implications of this decision<br />
<strong>for</strong> the interpretation of the results of the four studies?<br />
In trial A the entire distribution and, hence, the entire<br />
95% confidence interval lies above the threshold risk reduction<br />
of 1%. We can there<strong>for</strong>e be confident that the true<br />
treatment effect is above our threshold, and we have a definitive<br />
"positive" trial. That is, we can be very confident<br />
that the true reduction in risk is greater- probably appreciably<br />
greater -than 1 %; this leaves little doubt that we<br />
should administer the treatment to our patients. The sample<br />
size in this trial was adequate to show that the treatment<br />
provides a clinically important benefit.<br />
Trial B has the same point estimate of treatment effect as<br />
trial A (5%) and is also "positive" (p < 0.05). In a hypothesis<br />
-1 0 1 3 5<br />
% difference in mortality between<br />
experimental and control groups<br />
Page 11 of 27<br />
Fig. 1: Distributions of the likelihood of the true results of four trials (A,<br />
B, C and D). Trial A is a definitive and trial B a nondefinitive positive<br />
trial. Trial C is a definitive and trial D a nondefinitive negative trial.