CMAJ 1995 Basic Statistics for Clinicians
CMAJ 1995 Basic Statistics for Clinicians
CMAJ 1995 Basic Statistics for Clinicians

Create successful ePaper yourself
Turn your PDF publications into a flip-book with our unique Google optimized e-Paper software.
provide independent contributions to explaining the variation<br />
in walk-test scores. In other words, once we take the<br />
FEV, into account, the peak flow rates are not likely to be<br />
of any help in predicting walk-test scores; likewise, if we<br />
first took the peak flow rate into account, the FEV, would<br />
not provide further explanatory power in our model. Similarly,<br />
height was a significant predictor of walk-test score<br />
when considered alone, but it was no longer significant in<br />
the multiple regression because of its correlation with sex<br />
and FEV,.<br />
We have emphasized that the p value associated with a<br />
correlation provides little in<strong>for</strong>mation about the strength of<br />
the relation between two values; the correlation coefficient<br />
is required. Similarly, the knowledge that sex and FEV, independently<br />
explain some of the variation in walk-test<br />
scores tells us little about the power of our predictive<br />
model. We can get some sense of the model's predictive<br />
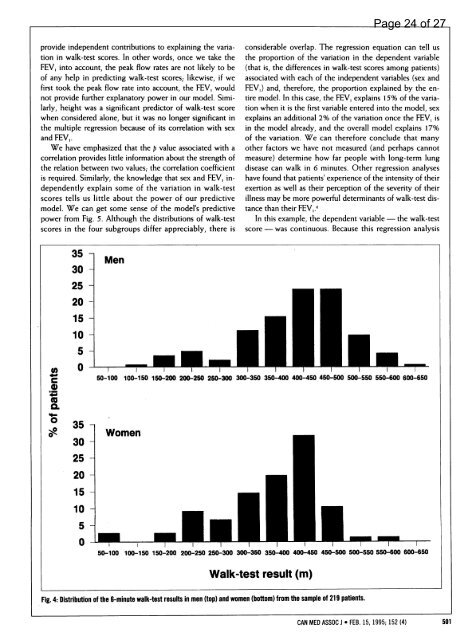
power from Fig. 5. Although the distributions of walk-test<br />
scores in the four subgroups differ appreciably, there is<br />
co<br />
*_0<br />
ax<br />
Q<br />
0<br />
I-11<br />
0<br />
35<br />
30<br />
25 -<br />
20 -<br />
15 -<br />
10 -<br />
5-<br />
0-<br />
35 -<br />
30 -<br />
25<br />
20 -<br />
15 -<br />
10 -<br />
5-<br />
Men<br />
considerable overlap. The regression equation can tell us<br />
the proportion of the variation in the dependent variable<br />
(that is, the differences in walk-test scores among patients)<br />
associated with each of the independent variables (sex and<br />
FEVI) and, there<strong>for</strong>e, the proportion explained by the entire<br />
model. In this case, the FEV, explains 15% of the variation<br />
when it is the first variable entered into the model, sex<br />
explains an additional 2% of the variation once the FEV, is<br />
in the model already, and the overall model explains 17%<br />
of the variation. We can there<strong>for</strong>e conclude that many<br />
other factors we have not measured (and perhaps cannot<br />
measure) determine how far people with long-term lung<br />
disease can walk in 6 minutes. Other regression analyses<br />
have found that patients' experience of the intensity of their<br />
exertion as well as their perception of the severity of their<br />
illness may be more powerful determinants of walk-test distance<br />
than their FEV,.6<br />
In this example, the dependent variable - the walk-test<br />
score - was continuous. Because this regression analysis<br />
50-100-10 50 150200 200 250 250-300 300-350 350-400 400-450 450-500 500-550 550-600 600-650<br />
Women<br />
0-<br />
50-100 100-150 150-200 200-250 250-300 300-350 350-400 400-450 450-500 500-550 550-600 600-650<br />
Walk-test result (m)<br />
Fig. 4: Distribution of the 6-minute walk-test results in men (top) and women (bottom) from the sample of 219 patients.<br />
Page 24 of 27<br />
CAN MED ASSOC J * FEB. 15, <strong>1995</strong>; 152 (4) 501