a PDF version - Continuous Casting Consortium - University of ...
a PDF version - Continuous Casting Consortium - University of ...
a PDF version - Continuous Casting Consortium - University of ...

Create successful ePaper yourself
Turn your PDF publications into a flip-book with our unique Google optimized e-Paper software.
2003 NSF Design, Service, and Manufacturing Grantees and Research Conf. Proceedings, R.G. Reddy, ed.,<br />
(Burmingham, AL, Jan. 6-9 2003), <strong>University</strong> <strong>of</strong> Alabama, Tuscaloosa, AL 35498, USA, pp. 2328-2362.<br />
ABSTRACT<br />
Flow Dynamics and Inclusion Transport in <strong>Continuous</strong> <strong>Casting</strong> <strong>of</strong> Steel<br />
B.G. Thomas, Q. Yuan, L. Zhang, and S.P. Vanka<br />
<strong>University</strong> <strong>of</strong> Illinois at Urbana-Champaign<br />
Mechanical and Industrial Engineering.<br />
1206 West Green Street, Urbana, IL 61801<br />
Ph: 217-333-6919, 217-244-4656; Fax: 217-244-6534;<br />
Email: bgthomas@uiuc.edu<br />
The quality <strong>of</strong> continuous cast steel is greatly affected by fluid flow in the mold region, especially involving the<br />
transport and entrapment <strong>of</strong> inclusion particles. As part <strong>of</strong> a long-term effort to develop and apply<br />
comprehensive models <strong>of</strong> these and other phenomena, this paper reports on work during the first year <strong>of</strong> this<br />
NSF grant to develop quantitative models <strong>of</strong> transient flow and inclusion transport in the continuous casting <strong>of</strong><br />
steel, and to apply them to improve understanding and efficiency <strong>of</strong> inclusion particle removal.<br />
Results are reported here for five interrelated subprojects. Firstly, models <strong>of</strong> transient flow using Large Eddy<br />
Simulation (LES), which were previously validated with digital particle image velocimetry (PIV) measurements<br />
in half <strong>of</strong> a single phase water model <strong>of</strong> the mold region, are extended to predict asymmetric flow in a full water<br />
model and the accompanying transport <strong>of</strong> inclusion particles. The flow results are validated through<br />
comparison with water model measurements and reveal the importance <strong>of</strong> interaction between the two sides <strong>of</strong><br />
the caster in producing the large fluctuations. Secondly, the flow model results are used to compute other<br />
phenomena <strong>of</strong> greater influence. Top surface level height is several mm higher towards the narrow faces.<br />
Particles are transported according to the local velocities, whose turbulent variations in both time and position<br />
lead to asymmetries. Heat transfer in the molten steel pool due to jet impingement requires at least a ½<br />
domain, and a fine mesh to achieve reasonable accuracy. Thirdly, an inclusion size evolution model has been<br />
developed for steel melts deoxidized with aluminum. The nucleation <strong>of</strong> alumina inclusions is very fast and<br />
their growth is dominated by turbulent collisions once the particles grow to larger than about 2µm from<br />
Ostwald ripening and Brownian motion. Fourthly, an accurate collision probability model has been developed<br />
for particle sizes smaller than 40 µm attaching to bubbles. Argon gas bubbles entering the mold are 1-5mm in<br />
diameter and greatly increase inclusion removal by attaching with particles. Finally, inclusion entrapment<br />
computations compared with measurements in steel product reveal that only a small fraction <strong>of</strong> the total number<br />
<strong>of</strong> mainly-small inclusions entering the caster appear to be removed, so there is incentive to remove them<br />
during upstream processing.
B.G. Thomas, Q. Yuan, L. Zhang, and S.P. Vanka, 2003 NSF Design, Service, Manufacturing and Industrial Innovation Research Conf.,<br />
Birmingham, Alabama, January 6-9, 2003<br />
1. INTRODUCTION<br />
<strong>Continuous</strong> casting produces 96% <strong>of</strong> the steel manufactured in the U.S. [1] and is the last, and most<br />
important, processing step where inclusions can either be generated or removed. Lowering inclusion-related<br />
defects is important to improving steel minimum strength, fatigue life, surface appearance, yield and energy<br />
efficiency (from reduced rejects), and thereby increase steel industry competitiveness. Moreover, reliable<br />
lowering <strong>of</strong> inclusion entrapment could allow thinner gage products (with associated weight and energy<br />
savings) and could reduce the need for costly and energy-intensive secondary refining steps, such as vacuum<br />
arc refining and electroslag remelting. Thus, there are tremendous economic, environmental and safety<br />
incentives for understanding how to lower the inclusion content <strong>of</strong> steel.<br />
Plant observations have found that many serious quality problems, including inclusion entrapment, are<br />
directly associated with the flow pattern in the mold. [2] Defects caused by nonoptimal fluid flow are even<br />
more important to the nearer-net-shape thin-slab casting processes, which are starting to transform the<br />
industry. [3] This is because higher velocities are required through a smaller inlet nozzle to cast a thin section<br />
slab with the same throughput. Thus, design and control <strong>of</strong> the fluid flow pattern in the continuous casting<br />
mold to minimize inclusions is <strong>of</strong> crucial importance to the steel industry.<br />
The flow pattern in the mold can be controlled by many variables, including the nozzle and mold geometry,<br />
submergence depth, steel flow rate, argon injection rate, electromagnetic stirring, and flux layer properties.<br />
Many <strong>of</strong> these parameters are easy and inexpensive to change and yet have a pr<strong>of</strong>ound influence on flow<br />
and corresponding quality. Currently, flow pattern design is done through trial and error, based on<br />
qualitative experiments with water models, plant trials, and the plant operator’s experience with defects.<br />
Identifying an optimal flow pattern is very difficult, because the fundamental relationship between flow<br />
pattern and inclusion entrapment has not been quantified. Thus, each casting operation requires its own<br />
expensive experiments, and old defects <strong>of</strong>ten reappear when changes in the process occur. With so many<br />
different operations and new processes to optimize, the industry can no longer afford this approach.<br />
In previous studies, the principal investigators have applied computational models to increase understanding<br />
<strong>of</strong> flow in the continuous casting mold, using both steady-state [4-21] and transient simulations. [22-29] The<br />
reliability <strong>of</strong> these models to predict flow has been demonstrated through comparison with both water<br />
models [9-11, 16, 19, 20, 24, 27, 28] and flow measurements in an operating steel caster. [26, 28] The next step is to apply<br />
these models to investigate fundamentally, the associated transport and entrapment <strong>of</strong> inclusion particles and<br />
to determine quantitative relationships between flow pattern control parameters (eg. nozzle geometry) and<br />
2
B.G. Thomas, Q. Yuan, L. Zhang, and S.P. Vanka, 2003 NSF Design, Service, Manufacturing and Industrial Innovation Research Conf.,<br />
Birmingham, Alabama, January 6-9, 2003<br />
particle entrapment. The current research is concerned with developing and applying such computations,<br />
combined with physical water modeling studies to validate the models and to provide further insight.<br />
Finally, plant trials are conducted to further validate the models, and to test proposed improvements. The<br />
results <strong>of</strong> this study should benefit to the steel industry by leading to increased fundamental understanding<br />
<strong>of</strong> inclusion entrapment, and to improvements in design and operating conditions that improve flow pattern<br />
in the continuous casting strand and lower costly defects.<br />
2. THE PROCESS<br />
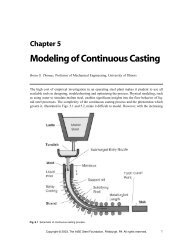
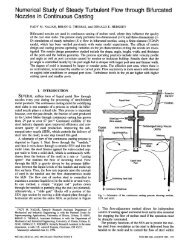
A schematic <strong>of</strong> part <strong>of</strong> the continuous casting process is depicted in Figure 1. [30] Steel from the ladle flows<br />
through the “tundish,” and then it exits down through a ceramic Submerged Entry Nozzle (SEN) and into<br />
the mold. Here, the steel freezes against the water-cooled copper walls to form a thin solid shell, which is<br />
continuously withdrawn from the bottom <strong>of</strong> the mold at a “casting speed” that matches the flow <strong>of</strong> the<br />
incoming metal. Flow through the SEN is gravity driven by the pressure difference between the liquid<br />
levels <strong>of</strong> the tundish and the mold top free surfaces. The flow rate is controlled (using feedback from a level<br />
sensor) to maintain the liquid level in the mold as constant as possible. In one method, a “stopper rod”<br />
extends down through the tundish to partially plug the exit. In another method, a “slide gate” blocks <strong>of</strong>f a<br />
portion <strong>of</strong> the SEN pipe section by moving a disk-shaped plate through a horizontal slit across the entire<br />
SEN. Such flow adjustment methods allow for independent control <strong>of</strong> casting speed and metal level, and are<br />
essential for stopping the flow <strong>of</strong> molten steel if the operation must be abruptly terminated. The submerged<br />
nozzle protects the molten steel from exposure to air, which helps to avoid reoxidation and inclusion<br />
formation. Together with the casting speed, mold geometry, argon gas injection rate, and other parameters,<br />
the nozzle geometry also controls the flow pattern created in the mold cavity. This flow pattern in turn<br />
controls the entrapment <strong>of</strong> inclusions and other defects which determine the steel quality.<br />
3. THE PROBLEM<br />
As shown in Fig. 1, the superheated jet <strong>of</strong> molten steel from the nozzle traverses across the mold cavity to<br />
impinge on the solidifying steel shell near the narrow faces. If the superheat is too large, the flow may<br />
break through the shell to create a costly breakout. The jets <strong>of</strong> molten steel exiting the nozzle also carry<br />
particles into the mold cavity in the form <strong>of</strong> oxide inclusions and argon bubbles, to which inclusions may<br />
attach. In addition, high speed flow across the top surface may shear droplets <strong>of</strong> liquid mold slag into the<br />
flow, where they may become entrained in the liquid steel. [31] If the flow pattern enables the particles to<br />
3
B.G. Thomas, Q. Yuan, L. Zhang, and S.P. Vanka, 2003 NSF Design, Service, Manufacturing and Industrial Innovation Research Conf.,<br />
Birmingham, Alabama, January 6-9, 2003<br />
reach the top surface, they should be harmlessly removed into the liquid slag layer. However, when the<br />
flow pattern is detrimental, particles become entrapped in the solidifying steel shell, where they cause<br />
serious quality problems and costly rejects. Particles trapped near the meniscus generate surface<br />
delamination defects, and may initiate surface cracks. This occurs when the flow pattern generates<br />
excessive surface level fluctuations or insufficient liquid temperatures, so that particles are entrapped by the<br />
solidifying meniscus before they can enter the liquid slag. Particles which are entrained into the lower<br />
recirculation zones can gradually spiral and become trapped in the solidifying front deep inside the<br />
product, [15, 32] leading to internal cracks, slivers in the final rolled product, and blisters. [2] One <strong>of</strong> these<br />
defects, known as “pencil pipes” [31] is caused when small argon gas bubbles surrounded by inclusions are<br />
caught in the solidifying shell. During rolling, the inclusion clusters elongate to create long slivers in the<br />
final product. During subsequent annealing processes, the trapped bubbles expand to create surface<br />
blisters. [31] These intermittent defects are particularly costly because they are <strong>of</strong>ten not detected until after<br />
many subsequent finishing steps. Thus, there is a great incentive to understand how to control the mold<br />
flow pattern in order to minimize particle entrapment and the associated quality problems.<br />
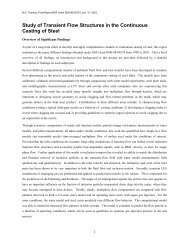
4. PREVIOUS WORK<br />
In work supported by a previous grant, “Study <strong>of</strong> Transient Flow Structures in the <strong>Continuous</strong> <strong>Casting</strong> <strong>of</strong><br />
Steel”, significant advances were made to develop and validate fluid flow modeling tools and to apply them<br />
to increase understanding and to improve the continuous casting process. Some <strong>of</strong> this work is summarized<br />
briefly below. More results and details are provided in the more than 30 publications resulting from this<br />
project to date [16-21, 24-29, 33-52] and in the website http://ccc.me.uiuc.edu. The flow modeling capability<br />
developed in this previous work is being extended to fundamental and practical applications, which are<br />
briefly discussed in Section 5 <strong>of</strong> this paper.<br />
A. Improved models <strong>of</strong> flow in continuous casting nozzles and mold<br />
Several different computational models have been developed to simulate turbulent fluid flow and heat<br />
transfer in continuous casting nozzles and molds, including both large eddy simulations (LES) and<br />
conventional time-averaged models, (such as K-ε). [25-27] They have been applied to increase understanding,<br />
identify and quantify some <strong>of</strong> the transient features <strong>of</strong> the flow field in the continuous casting nozzle, mold,<br />
and slag layers, and how they interact. Modeling procedures for obtaining quantitative predictions have<br />
been identified. The time-averaged flow pattern predicted from four different methods were compared and<br />
found to agree reasonably. [52] A transient simulation LES1 was computed with a refined Large Eddy<br />
4
B.G. Thomas, Q. Yuan, L. Zhang, and S.P. Vanka, 2003 NSF Design, Service, Manufacturing and Industrial Innovation Research Conf.,<br />
Birmingham, Alabama, January 6-9, 2003<br />
Simulation model and the Smagorinsky subgrid scale model, while LES2 used a fine 1.5 million-node grid<br />
with no turbulence model (so is really DNS). Time-average results from a conventional K-ε model were<br />
similar, although it cannot predict the time-fluctuations properly. Flow field measurements obtained using<br />
Particle Image Velocimetry on a scale water mode also matched. [52] Finally, the computational results also<br />
compared favorably with velocity measurements in the operating steel caster, [52] using a pair <strong>of</strong><br />
electromagnetic sensors embedded in the mold wall. [53] Calculations identified how the sensors are reliable<br />
only when placed near to the top surface, and when the flow direction is horizontal. [28] All four methods<br />
compared are reasonably close for conditions <strong>of</strong> single phase flow.<br />
The important influence <strong>of</strong> inlet conditions into the mold on transient flow features was identified using the<br />
computational models. Specifically, accurate modeling <strong>of</strong> the nozzle flow to obtain better inlet conditions<br />
was found to change some flow features (such as increasing surface velocities) and better match with the<br />
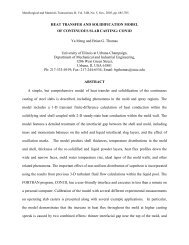
PIV and plant measurements.<br />
B. Benchmark experiments for continuous casting model validation<br />
Experiments were conducted to quantify fluid flow, superheat dissipation, solidifying steel shell growth,<br />
heat transfer and microstructure during the continuous casting <strong>of</strong> stainless-steel slabs at the AK Steel caster<br />
in Mansfield, OH. [54] These experimental measurements were further applied to develop, calibrate, and<br />
validate mathematical models <strong>of</strong> both fluid flow and heat flow in continuous casting. [16] Three-dimensional<br />
turbulent flow <strong>of</strong> molten steel in the nozzle and the mold cavity is modeled with the finite difference code<br />
CFX 4.2, [55] using the standard K-ε turbulence model and a fixed, structured grid. The results agree with<br />
flow measurements in a full-scale water model. The corresponding steady heat conduction equation is<br />
solved to predict the distribution <strong>of</strong> superheat in the molten pool. The predicted temperatures in the molten<br />
steel compare well with measurements conducted by inserting a thermocouple probe downward through the<br />
top surface at several locations in the operating thin slab caster. Next, solidification <strong>of</strong> the steel shell is<br />
simulated using a transient heat conduction model that features a detailed treatment <strong>of</strong> the flux layers in the<br />
interfacial gap and incorporates the superheat flux calculated from the fluid flow model. This model was<br />
calibrated with temperature measurements obtained from thermocouples in the copper mold during<br />
operation. It was run under the transient conditions present during a breakout. The predicted shell thickness<br />
pr<strong>of</strong>iles are compared with many shell thickness pr<strong>of</strong>iles measured around the perimeter <strong>of</strong> a breakout shell.<br />
Of greatest interest is the uneven thinning <strong>of</strong> the shell near the narrow face where the steel jet impinges,<br />
which is different between steady-state and the transient conditions <strong>of</strong> the breakout. This work provides a<br />
5
B.G. Thomas, Q. Yuan, L. Zhang, and S.P. Vanka, 2003 NSF Design, Service, Manufacturing and Industrial Innovation Research Conf.,<br />
Birmingham, Alabama, January 6-9, 2003<br />
set <strong>of</strong> benchmark experiments for future continuous-casting model development. It further demonstrates the<br />
quantitative ability <strong>of</strong> this modeling approach to simulate coupled fluid flow and solidification heat<br />
conduction in a real steel continuous casting process.<br />
C. Nozzle model development and application<br />
Measurements were conducted to validate the ability <strong>of</strong> flow models to simulate turbulent, multiphase flow<br />
through the continuous casting nozzle. [18, 56] The experiments were conducted using particle image<br />
velocimetry on 0.4-scale physical water models <strong>of</strong> the process, using the PIV system at LTV Steel Technical<br />
Center. The validated nozzle model has been applied to perform a large, systematic study <strong>of</strong> the effect <strong>of</strong><br />
important operating parameters on flow exiting the nozzle. [19, 56] Specifically, the jet characteristics<br />
(direction, speed, spread, etc.) exiting the nozzle ports are quantified for different operating parameters<br />
(nozzle bore diameter, slide gate orientation, slide gate opening fraction, injected fraction <strong>of</strong> argon gas, etc.).<br />
These results are a necessary first step in determining the important flow pattern in the mold.<br />
D. Nozzle model application: argon gas flow optimization<br />
The validated multiphase flow model <strong>of</strong> the nozzle was applied to perform over 150 simulations, in order to<br />
optimize argon gas injection levels in the nozzle for a range <strong>of</strong> practical conditions. [56] Specifically, the<br />
model results were processed (using simple inverse models) to quantify the minimum argon gas injection<br />
levels needed to avoid negative pressure in the nozzle, and thereby avoid air aspiration and the<br />
accompanying reoxidation, inclusion formation, and nozzle clogging. Increasing argon gas was found to<br />
generally increase nozzle pressure. Some conditions (low tundish level and low casting speed) required<br />
very little gas to avoid detrimental air aspiration, while other conditions (deep tundish) required more argon<br />
than is practical. [20] The model results can also be used as a clogging index to detect when nozzle clogging<br />
is present, before harmful flow defects occur. The implications <strong>of</strong> these results have been extended in a<br />
comprehensive review on how to avoid nozzle clogging. [21]<br />
E. Particle Transport in the Mold<br />
Finally, preliminary studies were performed to predict inclusion transport by extending the LES model <strong>of</strong><br />
transient flow fields in the mold region. Specifically, Lagrangian particle trajectories were calculated <strong>of</strong><br />
plastic beads in a water model and compared with measurements <strong>of</strong> the distribution and flotation removal <strong>of</strong><br />
the inclusion particles [47] . The LES model was able to reasonably match the measurements both<br />
qualitatively and quantitatively. Large particle removal rates were found, (nearly 80%) likely owing to the<br />
inability <strong>of</strong> the smooth walls <strong>of</strong> the water model to entrap particles. Finally, it was found that large numbers<br />
6
B.G. Thomas, Q. Yuan, L. Zhang, and S.P. Vanka, 2003 NSF Design, Service, Manufacturing and Industrial Innovation Research Conf.,<br />
Birmingham, Alabama, January 6-9, 2003<br />
<strong>of</strong> particles were required (> 10,000) to obtain reproducible predictions or measurements, owing to the<br />
chaotic nature <strong>of</strong> the particle motion.<br />
5. CURRENT RESULTS<br />
The present paper reports on some recent results from five different components <strong>of</strong> the current multifaceted<br />
research project involving dynamic flow and inclusion transport in the continuous casting mold:<br />
A) asymmetric transient flow<br />
B) surface level, particle transport, and heat transfer in the molten pool<br />
C) nucleation and growth <strong>of</strong> alumina inclusions in molten steel<br />
D) effect <strong>of</strong> bubbles on inclusion removal<br />
E) inclusion removal in the steel caster<br />
A. Asymmetric Transient Flow and Particle Transport<br />
Previous computational studies <strong>of</strong> flow in the continuous casting mold focused exclusively on symmetrical<br />
flows. Thus, the first project here investigates asymmetric flow in a full model <strong>of</strong> the process, consisting <strong>of</strong><br />
both the complete nozzle (including the stopper rod, submerged entry nozzle and ports) and the mold region.<br />
Sample results are presents here from two simulations using the LES approach. First, the flow in a fullscale<br />
water model was simulated and compared with measurements. Then a simulation <strong>of</strong> the turbulent<br />
flow and inclusion transport in the corresponding full-scale steel caster is performed. The conditions were<br />
chosen to match conditions at the AK Mansfield thin slab caster documented elsewhere [16, 54] where plant<br />
measurements were already available (132 x 984mm section, 1 m/min, 59 0 C superheat).<br />
The flow in the complex shaped nozzle is computed using LES (with approx. 630,000 cells), and the exit<br />
velocities were stored every 0.025 seconds for a period <strong>of</strong> 9.45 seconds. These were then used as inlet<br />
values to the two mold flow simulations, and recycled periodically. This two-step procedure greatly<br />
improved stability <strong>of</strong> the computation, while lowering the memory needed for a given simulation to less<br />
than 1.5 GB, (memory currently limits the problem size).<br />
The time-dependent three-dimensional Navier-Stokes equations were solved using the Harlow-Welch<br />
fraction step procedure. Second order central differencing is used for the convection terms and the Crank-<br />
7
B.G. Thomas, Q. Yuan, L. Zhang, and S.P. Vanka, 2003 NSF Design, Service, Manufacturing and Industrial Innovation Research Conf.,<br />
Birmingham, Alabama, January 6-9, 2003<br />
Nicolson scheme is used for the diffusion terms. The Adams-Bashforth scheme is used to discretize in time<br />
with second order accuracy. The pressure Poisson equation is solved using an Algebraic Multi-grid solver.<br />
No sub-grid model was used, while a dynamic model for the sub-grid scale kinetic energy has been<br />
developed for the use <strong>of</strong> continuing simulations. Computational grids consisting <strong>of</strong> 0.7 million and 1.3<br />
million cells are used for these two mold region computations.<br />
The water model differs from the real steel caster in several respects important to fluid flow. First, the side<br />
walls <strong>of</strong> the water model, which represent the moving solidifying shell, are non-porous and stationary.<br />
Further, the water model has a flat bottom with outlet ports to represent the tapering molten pool <strong>of</strong> a curved<br />
casting machine. Figure 2 shows the computational domain <strong>of</strong> the steel caster, which includes these effects.<br />
Special source terms were added for both mass and momentum in order to satisfy the conditions on the<br />
moving boundaries <strong>of</strong> the domain, which represent the dendritic solidification front.<br />
Figures 3 and 4 present typical instantaneous and time-averaged (over 22 seconds) velocity vector plots at<br />
the centerplane <strong>of</strong> the steel casting machine This particular nozzle geometry features an additional central<br />
downward jet entering the mold, in addition to the classic bifurcated nozzle ports sending fluid toward the<br />
narrow faces. The turbulent structures in the mold and a slight asymmetry between the two side jets can be<br />
seen in this instantaneous plot. The time-averaged plot shows a double-roll flow pattern on each side.<br />
Qualitatively similar flow patterns are also seen in the water model simulation.<br />
Figure 5 compares LES with the dye injection measurement in the water model. The solid line shows the<br />
flow speed along the jet centerline obtained from LES average data. The dark dots present the measured<br />
speed. A reasonable agreement is seen between LES and the measurements.<br />
The difference between water models and real steel casting machines is investigated in Figures 5 and 6,<br />
which compare the time-averaged downwards flow velocity (and its rms) <strong>of</strong> the water model and casting<br />
machine along a horizontal line 1000mm below the meniscus and 164mm from the narrow face. The data<br />
are time averaged over 48s and 22s for the water model and casting machine respectively. Figure 5 shows a<br />
bigger spatial variation <strong>of</strong> the downwards velocity for the water model. It also shows that the steel caster<br />
has less upward (ie “reverse”) flow. Two main reasons are suspected to cause this: the tapering and<br />
solidification restricts the flow domain, which makes the flow easier to get evenly distributed; and the<br />
downwards withdrawing <strong>of</strong> the shells prevents the flow from having upwards velocities. An asymmetry<br />
8
B.G. Thomas, Q. Yuan, L. Zhang, and S.P. Vanka, 2003 NSF Design, Service, Manufacturing and Industrial Innovation Research Conf.,<br />
Birmingham, Alabama, January 6-9, 2003<br />
between the two sides can also be seen for both the water model and casting machine, implying that a low<br />
frequency oscillation between the two sides exists and 48 seconds are not enough for the time average.<br />
Figure 7 shows the time-variation <strong>of</strong> the horizontal velocity towards the SEN at the center points between<br />
the SEN and the narrow faces on the meniscus, obtained from the steel caster simulation. This figure shows<br />
a large transient component, which is observed in water models, but was not observed in half-caster<br />
simulations (which assumed symmetrical flow in each half). This suggests that interaction between the two<br />
sides <strong>of</strong> the caster is the cause the large fluctuations. The variations are significant, because the level<br />
fluctuations which accompany them are the major cause <strong>of</strong> defects in the process.<br />
B. Surface Level, Particle Transport, and Heat Transfer in the Molten Pool<br />
Having been validated, the flow model is next applied to investigate related phenomena. Although a critical<br />
first step, the flow field is not the primary interest <strong>of</strong> this project. Defects in the process are generated by<br />
the phenomena which accompany the dynamic flow field. These include motion <strong>of</strong> the top surface level,<br />
transport <strong>of</strong> inclusion particles, and heat transfer. Each <strong>of</strong> these is discussed in turn:<br />
i). Top Surface Level<br />
Figure 8 shows an example <strong>of</strong> the instantaneous variation in surface level predicted from the pressure output<br />
from the LES flow model. The level is always higher near the narrow faces, by 4-6mm. This is because the<br />
steel momentum up the narrow faces lifts the liquid level there, displacing some <strong>of</strong> the molten flux. The<br />
flux layer must be thick enough to cover the steel, in order to provide a steady supply <strong>of</strong> molten flux into the<br />
interfacial gap to lubricate the steel. Insufficient flux consumption leads to temperature fluctuations which<br />
cause surface cracks and other defects in the solid steel product. Thus, the height <strong>of</strong> the surface “standing<br />
wave” is important to steel quality. The predictions here compare reasonably with industry measurements<br />
using nail boards and sheets.<br />
ii) Particle Transport and Entrapment<br />
Another important consequence <strong>of</strong> the flow pattern in the mold is the transport <strong>of</strong> inclusion particles within<br />
the molten pool. Inclusions may eventually be removed harmlessly into the top slag layer, or they may<br />
become entrapped in the solidifying shell. Fundamental criteria have been developed for the capture <strong>of</strong><br />
inclusions by a moving dendritic interface through engulfment or entrapment, considering together for the<br />
first time: critical interface velocity, particle size, and local cross-flow velocity. Small inclusions (
B.G. Thomas, Q. Yuan, L. Zhang, and S.P. Vanka, 2003 NSF Design, Service, Manufacturing and Industrial Innovation Research Conf.,<br />
Birmingham, Alabama, January 6-9, 2003<br />
are predicted to become surrounded by the dendrite arms and entrapped with little chance <strong>of</strong> “particle<br />
pushing”. Figure 9 shows the particle distribution and entrapment locations at three instants for the mold<br />
and flow conditions just discussed, for such small inclusions.<br />
Particles are seen to move with the jet and reach the walls 0.6 seconds after injection at 33s. The particles<br />
split into two groups by 2 seconds (second frame) and enter the upper and lower rolls. Although the flow<br />
and distribution exiting the nozzle is initially almost symmetrical, a significant asymmetry can be seen to<br />
develop in the 15 s plot, indicating the important effects <strong>of</strong> flow asymmetry on particle transport. It is<br />
important to note that the inlet velocity distribution was relatively uniform during this time, so the<br />
asymmetry in this case is caused solely by chaotic turbulent motion below the mold. The downward motion<br />
corresponds to large asymmetry between the velocities at these 2 points, showing that particle motion is<br />
dominated by the flow distribution, regardless <strong>of</strong> particle size. The velocities are seen in Figure 10 to<br />
fluctuate, indicating that particles injected at other times will show the opposite asymmetry or behave<br />
almost the same. These results are important because particles which are transported deeper are more likely<br />
to become permanently entrapped in the steel caster.<br />
iii) Heat Transfer in the Molten Steel Pool<br />
Large eddy simulations were next carried out to study transient fluid flow and turbulent heat transfer in this<br />
thin slab caster. Previous simulations <strong>of</strong> turbulent heat transfer in unconstrained circular impinging jets<br />
revealed that very fine meshes are needed near the impingement plate to predict the heat transfer rate<br />
correctly in LES simulations [26] . Heat transfer simulations require higher grid density than flow simulations.<br />
Two simulations <strong>of</strong> a real steel caster have been carried out. First a ¼ mold simulation was performed with<br />
0.8 million finite volume cells, assuming symmetrical boundary conditions on the two vertical center-planes<br />
<strong>of</strong> the simulation domain. This produced results which did not match the water model, or the full-mold<br />
simulations. The imposed WF-WF symmetry condition severely constrained the jet coming out from the<br />
side port so that it had too much diffusion in the vertical direction. Consequentlly, there was quiescent flow<br />
in the top region, with no upper recirculation zone in the flow field. This incorrect flow field produces a<br />
weak jet impingement that gives a lower heat transfer rate on the NF, and allows the upper corner region to<br />
freeze. Thus, the application <strong>of</strong> two-fold WF-WF symmetry is inappropriate for transient LES simulations.<br />
10
B.G. Thomas, Q. Yuan, L. Zhang, and S.P. Vanka, 2003 NSF Design, Service, Manufacturing and Industrial Innovation Research Conf.,<br />
Birmingham, Alabama, January 6-9, 2003<br />
The ½ mold simulation (1.6 million finite volume cells) addresses this problem and shows good tendency<br />
towards a correct solution. Figure 11 shows an instantaneous snapshot <strong>of</strong> the velocity and temperature fields<br />
in the ½ mold simulation. The flow field compares reasonably well with the dye-injection experiment and<br />
full-mold computations presented in section 5A.<br />
C. Nucleation and Growth <strong>of</strong> Alumina Inclusions in Molten Steel<br />
Inclusion distribution computations require knowledge <strong>of</strong> the size distribution <strong>of</strong> particles entering the<br />
caster. The size distribution may be important to inclusion entrapment, and the size <strong>of</strong> captured inclusions<br />
is crucial to final steel quality, as defects increase with the size <strong>of</strong> non-metallic inclusion clusters. Previous<br />
work has used measured size distributions as the initial condition [35] . As part <strong>of</strong> this project, a fundamental<br />
model has been developed to predict the size distribution <strong>of</strong> indigineous inclusions in low carbon steels<br />
deoxidized with aluminum.<br />
Inclusions arise from many sources, including deoxidation, reoxidation, slag entrapment, chemical<br />
reactions, and exogenous inclusions. Inclusion evolution and removal is affected by diverse complex<br />
phenomena, including deoxidant quantity, composition, and morphology, vessel geometry, transport by<br />
turbulent flow, interfacial tension, diffusion coefficient, the initial oxygen content, collisions with both<br />
bubbles and other particles, reoxidation, temperature, and properties <strong>of</strong> the slag layer and vessel walls where<br />
inclusions may be removed or generated. A common characteristic <strong>of</strong> indigenous alumina inclusions in Low<br />
Carbon Al-Killed (LCAK) steel [57-70] is that the central globule, secondary dendrite arms, or the individual<br />
spherical inclusions in an inclusion cluster is consistently 1~4 µm (Fig. 12).<br />
A computational model based on classic homogenous nucleation theory, thermodynamic analysis and<br />
numerical simulation, has been developed to predict <strong>of</strong> the nucleation and growth <strong>of</strong> the alumina size<br />
distribution in the molten steel, including the effects <strong>of</strong> Ostwald ripening, Brownian collision and turbulent<br />
collision. The model was tested by applying it to aluminum deoxidation <strong>of</strong> a typical steel-oxygen system,<br />
where previous measurements and calculations were available. The vessel was a 50 tonne ladle <strong>of</strong> lowcarbon<br />
steel refined in an ASEA-SKF furnace. [71] The total oxygen before adding aluminum is around 300<br />
ppm and the final free oxygen is about 3 ppm, which corresponds to a 46kg aluminum addition. The delay<br />
constant K was assumed to be 0.1. [72] The ladle had 2.3m diameter and 1.7m depth, which corresponds to a<br />
turbulent energy dissipation rate in the melt <strong>of</strong> 0.01224 m 2 /s 3 (856.8 erg/cm 3 s).<br />
11
B.G. Thomas, Q. Yuan, L. Zhang, and S.P. Vanka, 2003 NSF Design, Service, Manufacturing and Industrial Innovation Research Conf.,<br />
Birmingham, Alabama, January 6-9, 2003<br />
Starting with rapid supersaturation with Al2O3 “pseudo-molecules”, homogeneous nucleation is very fast,<br />
occurring mainly between 1µs and 10µs. The stable inclusion nuclei are predicted to be only about 10-20 Å<br />
in diameter. The growth <strong>of</strong> inclusions smaller than 1µm in radii is mainly controlled by diffusion <strong>of</strong> pseudo-<br />
molecules and Brownian collision, and inclusions in this range tend to be spherical. The growth <strong>of</strong><br />
inclusions larger than 2µm in radii is mainly controlled by turbulent collisions, and inclusions in this range<br />
tend to form clusters which retain minimum feature sizes <strong>of</strong> 1~2µm.<br />
Figure 13 shows a histogram <strong>of</strong> inclusion size distribution at different times after adding aluminum to the<br />
ladle, assuming that all inclusions with radii larger than 36µm are instantly removed to the top slag.<br />
Inclusion size distribution can reach 0.1~1µm at 6s and 0.1~36µm at 100s, which agrees roughly with the<br />
industrial measurements [73, 74] After 720 seconds, total oxygen in the steel decreases to around 20 ppm,<br />
which agrees with other measurements. [71]<br />
In addition to providing needed input conditions for the mold inclusion calculations, this deoxidation model<br />
also reveals important insights into optimal steel refining practice. The effect <strong>of</strong> stirring power on the<br />
oxygen removal rate constant in different steel refining vessels is shown in Fig. 14 [75, 76] . Excessive stirring<br />
is detrimental as the upward circulation <strong>of</strong> steel onto the slag layer may expose an “eye” region <strong>of</strong> the steel<br />
surface to reoxidation and the lining may be seriously eroded. The calculated effect <strong>of</strong> stirring power on<br />
inclusion size distribution, shown in Fig. 15, indicate that increasing stirring power generates more large<br />
inclusions in the bulk. If these inclusions can be removed into the slag, this improves cleanliness. This is<br />
very bad for steel cleanliness, however, if the stirring power is high at the end <strong>of</strong> refining, when the new<br />
large inclusions have no time to be removed. Therefore, the recommended practice is to first stir vigorously,<br />
to encourage the collision <strong>of</strong> small inclusions into large ones, followed by a “final stir” that slowly<br />
recirculates the steel to facilitate their removal into the slag while minimizing the generation <strong>of</strong> more large<br />
inclusions via collisions.<br />
D. Interaction between inclusions and bubbles in liquid steel<br />
Inclusion removal from molten steel is greatly assisted by gas injection, which is also used to promote<br />
homogeneity in temperature and composition. Argon injection into the Submerged Entry Nozzle (SEN) <strong>of</strong><br />
continuous casting is very common, and also has a large effect on the mold flow pattern. Thus, fundamental<br />
models <strong>of</strong> the interaction between alumina inclusions and argon bubbles in steel are being developed. Figure<br />
12
B.G. Thomas, Q. Yuan, L. Zhang, and S.P. Vanka, 2003 NSF Design, Service, Manufacturing and Industrial Innovation Research Conf.,<br />
Birmingham, Alabama, January 6-9, 2003<br />
16 shows the terminal velocities <strong>of</strong> gas bubbles in liquid steel based on different models. [73, 77-83] The<br />
agreement among these models is very rough, so a mean relationship between bubble velocity and size is<br />
adopted. A peak rising velocity can be seen at a bubble diameter <strong>of</strong> 1-3 mm. In the regime smaller than 1<br />
mm, the bubbles are spherical [82] . When the equivalent bubble diameter exceeds 3 mm, the bubble shape<br />
becomes ellipsoidal and then spherical caps. Beyond 7 mm, the bubble velocity gradually increases again.<br />
The attachment <strong>of</strong> inclusions to bubbles is characterized by their collision probability, which is defined as<br />
the fraction <strong>of</strong> inclusions in the path <strong>of</strong> the bubble that actually collide with it and attach, Pc. Inclusions<br />
within area πdb 2 /4 attach to the bubble surface with probability Pc, as illustrated in Fig. 17. An upper limit,<br />
based on streamline potential flow, depends on the ratio <strong>of</strong> the area ( S OC ) inscribed by the limiting diameter<br />
( d OC ) to the area ( S B ) inscribed by the bubble diameter ( d B ).<br />
S<br />
⎛ d<br />
⎜<br />
⎝<br />
13<br />
⎞<br />
⎟<br />
⎠<br />
2<br />
oc oc<br />
PC = = ⎜ ⎟<br />
(1)<br />
S B d B<br />
This theory assumes that the particle attaches to the bubble if its trajectory, assumed to follow the fluid<br />
streamlines around the bubble, takes it within its radius <strong>of</strong> the bubble surface. Simulations were performed<br />
to improve on this simple theory by incorporating inertial effects, due to the density difference between<br />
particle and fluid. Alumina inclusions in steel with argon bubbles corresponds to the case <strong>of</strong> 2800 kg/m3 in<br />
Fig. 18, where the lighter particle is diverted further around the bubble, thus lowering its attachment<br />
probability, relative to heavy particles in water.<br />
For validation purposes, model predictions using FLUENT are compared in Fig. 19 with experiments in<br />
water measuring silica particle attachment probability to 1.52mm diameter air bubbles rising at 0.315 m/s.<br />
Agreement is good for small particles (< 40µm). This figure also validates the numerical formulation and<br />
choice <strong>of</strong> parameters such as mesh and time step size, because the probability computation for zero-drag<br />
neutral-density-particles matches the analytical solution. Fig. 19 also shows the importance <strong>of</strong> using the<br />
correct zero shear stress boundary condition at the bubble / fluid interface. Small particles are seen to have<br />
a higher collision probability with bubbles than with large solid particles, which have a no slip interface<br />
condition.
B.G. Thomas, Q. Yuan, L. Zhang, and S.P. Vanka, 2003 NSF Design, Service, Manufacturing and Industrial Innovation Research Conf.,<br />
Birmingham, Alabama, January 6-9, 2003<br />
Having been validated, the FLUENT model is next used to calculate collision probabilities between argon<br />
bubbles and small inclusions in molten steel. Figure 20 shows sample results, which indicate that smaller<br />
bubbles are more favorable for inclusion removal by bubble flotation (for a given gas fraction). However,<br />
the small bubbles at least have the following two shortcomings: 1).Smaller bubbles require longer rising<br />
time. In practice, shorter treatment times will significantly reduce operational costs by reducing the<br />
temperature loss and refractory consumption; 2). Small bubbles (
B.G. Thomas, Q. Yuan, L. Zhang, and S.P. Vanka, 2003 NSF Design, Service, Manufacturing and Industrial Innovation Research Conf.,<br />
Birmingham, Alabama, January 6-9, 2003<br />
plant experiments. Here, steady flow in the continuous caster is simulated with the standard k-ε two-<br />
equation turbulence model. Each inclusion trajectory is calculated by integrating its local velocity,<br />
considering its drag and buoyancy forces. A “random walk” model is used to incorporate the effect <strong>of</strong><br />
turbulent fluctuations on the particle motion. In this model, the particle moves within local turbulent eddies<br />
over the eddy lifetime. The local velocity fluctuation is based on a Gaussian-distributed random number,<br />
chosen according to the local turbulent kinetic energy, K. The random number is changed, thus producing a<br />
new instantaneous velocity fluctuation, with a frequency equal to the characteristic lifetime <strong>of</strong> the eddy.<br />
The inclusion entrapment model is being tested through comparison with plant experiments. The casting<br />
conditions are given in Table I. Inclusion size distributions were measured using “slime extraction”,<br />
whereby several hundred samples over many steel heats, each consisting <strong>of</strong> several hundred grams, were<br />
dissolved to extract the inclusions. The inclusions were suspended in water and their size distributions<br />
measured with a Coulter counter. Results are given in Fig. 22, which show that most <strong>of</strong> the inclusion mass<br />
is between 10-30 µm. Although rare, the inclusions larger than 50µm are very detrimental to steel quality,<br />
and can only be detected with large sample sizes. Thus, total oxygen measurements are less reliable means<br />
to quantify inclusion size distributions. Figure 23 shows the inclusion size distribution measured through<br />
the slab thickness, indicating that more inclusions are found near the surfaces.<br />
Table I Simulation parameters for Steel Caster<br />
Experiment<br />
Nozzle port size/Inlet port size (x×y) (m) 0.065×0.080<br />
Nozzle angle 15 o<br />
Submergence depth (m) 0.30<br />
Mold/Domain geometry specification Open bottom<br />
Mold/Domain height (m) 2.55<br />
Mold/Domain width (m) 1.3<br />
Mold/Domain thickness (m) 0.25<br />
Average inlet flow rate (m 3 /s) 0.00325<br />
<strong>Casting</strong> speed (m/min) 1.2<br />
Fluid density (kg/m 3 ) 7020<br />
Fluid kinetic viscosity (m 2 /s) 0.954×10<br />
Particle size (diameter) ((µm) 0.5-300<br />
Particle density (kg/m 3 ) 5000<br />
Turbulence model k-ε<br />
Inclusion motion model Random walk, 0.1s time step, 10000-<br />
15000 inclusion injected.<br />
Boundary condition to the Inclusions Escape from top surface and open<br />
15<br />
– 6
B.G. Thomas, Q. Yuan, L. Zhang, and S.P. Vanka, 2003 NSF Design, Service, Manufacturing and Industrial Innovation Research Conf.,<br />
Birmingham, Alabama, January 6-9, 2003<br />
bottom; at wide faces and narrow faces,<br />
inclusion will be trapped when they<br />
touch them.<br />
Inlet condition for fluid flow Simulation <strong>of</strong> nozzle outlet port<br />
Gas flow rate None<br />
The results tabulated in Table II, compare the inclusion fractions entrapped at different destinations with the<br />
industrial measurements. Figure 24 shows the entrapped positions on the wide face <strong>of</strong> 50 µm simulated<br />
inclusions. For inclusions smaller than 50 µm, only 7% are safely removed by the top surface, independent<br />
<strong>of</strong> inclusion size. A larger fraction <strong>of</strong> inclusions bigger than 50 µm are removed.<br />
The majority <strong>of</strong> inclusions (65%) are captured within 28mm <strong>of</strong> the surface, which represents the top 2.55m<br />
<strong>of</strong> the caster. This agrees only qualitatively with the measurements in Fig. 23. A disproportionately large<br />
fraction <strong>of</strong> these (24%) are captured in the narrow face, despite its smaller surface area, owing to the jet<br />
impingement against its inner solidification front. Inclusions exiting the domain are entrapped somewhere<br />
deeper than 28mm. If the entrapment criteria are the same for small and large inclusions, their entrapment<br />
to walls are very similar at 0-28mm slab surface thickness. Only 7-12% <strong>of</strong> the inclusions are predicted to be<br />
removed by the top surface, compared with a measured total inclusion volume fraction removal to top<br />
surface <strong>of</strong> 20%. Thus, the current entrapment model at the walls underpredicts inclusion removal. This is<br />
likely due in part to the neglect <strong>of</strong> interaction with argon bubbles in the present computation. Further work<br />
is needed to validate this model with the LES model predictions, and to refine the model to obtain better<br />
quantitative match with experiments, prior to performing parametric studies.<br />
Table II. Inclusions fractions entrapped at different positions in the caster<br />
Inclusion size<br />
Wide face Narrow face<br />
28-125mm Top<br />
0-15mm 15-28mm 0-15mm 15-28mm<br />
50mm 27% 15% 15% 10% 28% 7%<br />
225mm 29% 12% 14% 10% 23% 12%<br />
Industrial Measurement 20%<br />
16
B.G. Thomas, Q. Yuan, L. Zhang, and S.P. Vanka, 2003 NSF Design, Service, Manufacturing and Industrial Innovation Research Conf.,<br />
Birmingham, Alabama, January 6-9, 2003<br />
6. SIGNIFICANT FINDINGS<br />
Advanced computational models are being developed to predict quantitatively, the removal <strong>of</strong> inclusions in<br />
the mold region during the continuous casting steel. This multi-faceted research project includes models <strong>of</strong><br />
transient fluid flow in the nozzle and mold, fluctuation <strong>of</strong> the top free surface, and the transport <strong>of</strong> heat and<br />
inclusion particles. The final system <strong>of</strong> models will incorporate the results <strong>of</strong> other models, including: 1)<br />
nucleation and growth to find the inclusion size distributions, 2) argon bubble size distribution, relative<br />
rising velocity, and inclusion attachment probability, and 3) entrapment criteria at the solidification front<br />
and top surface. Each aspect <strong>of</strong> the models is being tested through extensive comparison with<br />
measurements, including the measurement <strong>of</strong> total inclusion entrapment in the cast steel product at the plant.<br />
This work has already obtained several findings, which are very significant to the accurate prediction <strong>of</strong><br />
inclusion behavior in continuous casting.<br />
1) The interaction between the left and right sides <strong>of</strong> the caster produces asymmetric flow, which is<br />
significant both at the top surface (influencing velocity fluctuations and standing wave), and in the lower<br />
recirculation zone (influencing entrapment to the shell).<br />
2) Particle transport is governed by the fluid flow pattern, leading to asymmetric entrapment pr<strong>of</strong>iles.<br />
3) Nucleation <strong>of</strong> alumina inclusions is very fast and growth is dominated by turbulent collisions once the<br />
particles grow to larger than about 2µm from Ostwald ripening and Brownian motion.<br />
4) Argon gas bubbles are 1-5mm in size and greatly increase inclusion removal by attaching to particles.<br />
Solid particles attaching to air bubbles in water behave differently than alumina particles attaching to argon<br />
bubbles in molten steel, so computational models are needed.<br />
5) Finally, inclusion particle entrapment locations are predicted and compared with measurements in the<br />
final product: only a small fraction <strong>of</strong> the total inclusions entering the caster (which are mainly smaller than<br />
30µm) appear to be removed, so there is great incentive to remove them during upstream processing. The<br />
removal <strong>of</strong> larger inclusions is more difficult both to measure and to compute, but is the focus <strong>of</strong> continuing<br />
efforts, owing to its greater importance to steel quality.<br />
17
B.G. Thomas, Q. Yuan, L. Zhang, and S.P. Vanka, 2003 NSF Design, Service, Manufacturing and Industrial Innovation Research Conf.,<br />
Birmingham, Alabama, January 6-9, 2003<br />
7. IMPACT<br />
This work aims to improve understanding <strong>of</strong> transient flow, inclusion transport and defect formation in the<br />
mold region during the continuous casting <strong>of</strong> steel slabs, through the development, validation, and<br />
application <strong>of</strong> fundamental computational models <strong>of</strong> transient fluid flow. Plant observations have found that<br />
many serious quality problems, including inclusion entrapment, are directly associated with the flow pattern<br />
in the mold. The results from the computational simulations <strong>of</strong> this work are increasing fundamental<br />
understanding <strong>of</strong> transient fluid flow, gas, and inclusion particle transport in the mold region. This will lead<br />
to optimized nozzle geometry and gas flow rates to improve mold flow patterns and minimize inclusion<br />
defects. Lowering defects from internal inclusions can improve steel minimum strength, fatigue life,<br />
surface appearance, yield and energy efficiency (from reduced rejects) and lower production cost.<br />
Furthermore, the computational tools developed and validated in this work can be applied to study and<br />
optimize flow in other processes.<br />
8. ACKNOWLEDGMENTS<br />
The authors wish to thank the National Science Foundation (Grant # DMI-01-15486) and the <strong>Continuous</strong><br />
<strong>Casting</strong> <strong>Consortium</strong> (Accumold, Huron Park, Ontario; AK Steel, Middletown, OH; Columbus Stainless<br />
Steel, Middelburg, South Africa; and Hatch Associates, Buffalo, New York) is gratefully acknowledged.<br />
Student Bin Zhao is thanked for two figures. Finally, thanks are due to FLUENT, Inc., for providing the<br />
FLUENT code, and to the National Center for Supercomputing Applications at the <strong>University</strong> <strong>of</strong> Illinois for<br />
computing time.<br />
9. REFERENCES<br />
1. "<strong>Continuous</strong>ly Cast Steel Output, 1999," Report, International Iron Steel Institute, Brussels,<br />
Belgium, 2000, www.worldsteel.org.<br />
2. J. Herbertson, Q.L. He, P.J. Flint, R.B. Mahapatra, "Modelling <strong>of</strong> Metal Delivery to <strong>Continuous</strong><br />
<strong>Casting</strong> Moulds," in Steelmaking Conf. Proceedings, Vol. 74, ISS, Warrendale, PA, 1991, 171-185.<br />
3. T. Honeyands and J. Herbertson, "Oscillations in Thin Slab Caster Mold Flows," 127th ISIJ<br />
Meeting, ISIJ, Tokyo, Japan, 1994.<br />
4. B.G. Thomas, "Application <strong>of</strong> Mathematical Models to the Contious Slab <strong>Casting</strong> Mold.," ISS<br />
Trans., Vol. 16 (12), 1989, 53-66.<br />
5. B.G. Thomas, "Mathematical Modeling <strong>of</strong> the <strong>Continuous</strong> Slab <strong>Casting</strong> Mold, a State <strong>of</strong> the Art<br />
Review," in Mold Operation for Quality and Productivity, A. Cramb, ed. Iron and Steel Society,<br />
Warrendale, PA, 1991, 69-82.<br />
18
B.G. Thomas, Q. Yuan, L. Zhang, and S.P. Vanka, 2003 NSF Design, Service, Manufacturing and Industrial Innovation Research Conf.,<br />
Birmingham, Alabama, January 6-9, 2003<br />
6. B.G. Thomas and F.M. Najjar, "Finite-Element Modeling <strong>of</strong> Turbulent Fluid Flow and Heat Transfer<br />
in <strong>Continuous</strong> <strong>Casting</strong>," Applied Mathematical Modeling, Vol. 15 (5), 1991, 226-243.<br />
7. X. Huang, B.G. Thomas and F.M. Najjar, "Modeling Superheat Removal during <strong>Continuous</strong> <strong>Casting</strong><br />
<strong>of</strong> Steel Slabs," Metall. Trans. B, Vol. 23B (6), 1992, 339-356.<br />
8. X. Huang and B.G. Thomas, "Modeling <strong>of</strong> Steel Grade Transition in <strong>Continuous</strong> Slab <strong>Casting</strong><br />
Processes," Metall. Trans., Vol. 24B (2), 1993, 379-393.<br />
9. D.E. Hershey, B.G. Thomas and F.M. Najjar, "Turbulent Flow through Bifurcated Nozzles," Int. J.<br />
Num. Meth. in Fluids, Vol. 17 (1), 1993, 23-47.<br />
10. B.G. Thomas and X. Huang, "Effect <strong>of</strong> Argon Gas on Fluid Flow in a <strong>Continuous</strong> Slab <strong>Casting</strong><br />
Mold," 76th Steelmaking Conference Proceedings, (Dallas, TX), Iron and Steel Society, Warrendale,<br />
PA, Vol. 76, 1993, 273-289.<br />
11. B.G. Thomas, X. Huang and R.C. Sussman, "Simulation <strong>of</strong> Argon Gas Flow Effects in a <strong>Continuous</strong><br />
Slab Caster," Metall. Trans. B, Vol. 25B (4), 1994, 527-547.<br />
12. G.D. Lawson, S.C. Sander, W.H. Emling, A. Moitra, B.G. Thomas, "Prevention <strong>of</strong> Shell Thinning<br />
Breakouts Associated with Widening Width Changes," in Steelmaking Conference Proceedings,<br />
Vol. 77, Iron and Steel Society, (Warrendale, PA), 1994, 329-336.<br />
13. F.M. Najjar, B.G. Thomas and D.E. Hershey, "Turbulent Flow Simulations in Bifurcated Nozzles:<br />
Effects <strong>of</strong> Design and <strong>Casting</strong> Operation," Metall. Trans. B, Vol. 26B (4), 1995, 749-765.<br />
14. R. McDavid and B.G. Thomas, "Flow and Thermal Behavior <strong>of</strong> the Top-Surface Flux/ Powder<br />
Layers in <strong>Continuous</strong> <strong>Casting</strong> Molds," Metall. Trans. B, Vol. 27B (4), 1996, 672-685.<br />
15. B.G. Thomas, A. Denissov and H. Bai, "Behavior <strong>of</strong> Argon Bubbles during <strong>Continuous</strong> <strong>Casting</strong> <strong>of</strong><br />
Steel," in Steelmaking Conference Proceedings, Vol. 80, ISS, Warrendale, PA., 1997, 375-384.<br />
16. B.G. Thomas, R. O'Malley, T. Shi, Y. Meng, D. Creech, D. Stone, "Validation <strong>of</strong> Fluid Flow and<br />
Solidification Simulation <strong>of</strong> a <strong>Continuous</strong> Thin Slab Caster," in Modeling <strong>of</strong> <strong>Casting</strong>, Welding, and<br />
Advanced Solidification Processes, Vol. IX, Shaker Verlag GmbH, Aachen, Germany, (Aachen,<br />
Germany, August 20-25, 2000), 2000, 769-776.<br />
17. H. Bai and B.G. Thomas, "Bubble Formation during Horizontal Gas Injection into Downward<br />
Flowing Liquid," Metall. Mater. Trans. B, 2001, under review.<br />
18. H. Bai and B.G. Thomas, "Turbulent Flow <strong>of</strong> Liquid Steel and Argon Bubbles in Slide-Gate Tundish<br />
Nozzles, Part I, Model Development and Validation," Metall. Mater. Trans. B, Vol. 32B (2), 2001,<br />
253-267.<br />
19. H. Bai and B.G. Thomas, "Turbulent Flow <strong>of</strong> Liquid Steel and Argon Bubbles in Slide-Gate Tundish<br />
Nozzles, Part II, Effect <strong>of</strong> Operation Conditions and Nozzle Design," Metall. Mater. Trans. B, Vol.<br />
32B (2), 2001, 269-284.<br />
19
B.G. Thomas, Q. Yuan, L. Zhang, and S.P. Vanka, 2003 NSF Design, Service, Manufacturing and Industrial Innovation Research Conf.,<br />
Birmingham, Alabama, January 6-9, 2003<br />
20. H. Bai and B.G. Thomas, "Effects <strong>of</strong> Clogging, Argon Injection and <strong>Continuous</strong> <strong>Casting</strong> Conditions<br />
on Flow and Air Aspiration in Submerged Entry Nozzles," Metall. Mater. Trans. B, 2001, in press.<br />
21. B.G. Thomas and H. Bai, "Tundish Nozzle Clogging – Application <strong>of</strong> Computational Models," in<br />
Steelmaking Conf. Proc., Vol. 18, Iron and Steel Society, Warrendale, PA, 2001, 895-912.<br />
22. B.G. Thomas, "Modeling Study <strong>of</strong> Intermixing in Tundish and Strand during a <strong>Continuous</strong>-<strong>Casting</strong><br />
Grade Transition," Iron and Steelmaker, Vol. 24 (12), 1997, 83-96.<br />
23. X. Huang and B.G. Thomas, "Modeling <strong>of</strong> Transient Flow Phenomena in <strong>Continuous</strong> <strong>Casting</strong> <strong>of</strong><br />
Steel," Canadian Metall. Quart., Vol. 37 (304), 1998, 197-212.<br />
24. B.G. Thomas, H. Bai, S. Sivaramakrishnan, S.P. Vanka, "Detailed Simulation <strong>of</strong> Flow in <strong>Continuous</strong><br />
<strong>Casting</strong> <strong>of</strong> Steel Using K-e, LES, and PIV," International Symposium on Cutting Edge <strong>of</strong> Computer<br />
Simulation <strong>of</strong> Solidification and Processes, (Osaka, Japan, Nov. 14-16, 1999), ISIJ, 1999, 113-128.<br />
25. B.G. Thomas and S.P. Vanka, "Study <strong>of</strong> Transient Flow Structures in the <strong>Continuous</strong> <strong>Casting</strong> <strong>of</strong><br />
Steel," NSF Design & Manufacturing Grantees Conference, (Long Beach, CA), NSF, Washington,<br />
D.C., 1999.<br />
26. B.G. Thomas and S.P. Vanka, "Study <strong>of</strong> Transient Flow Structures in the <strong>Continuous</strong> <strong>Casting</strong> <strong>of</strong><br />
Steel," NSF Design & Manufacturing Grantees Conference, (Vancouver, Canada), NSF,<br />
Washington, D.C., 2000, 14p.<br />
27. B.G. Thomas and S.P. Vanka, "Study <strong>of</strong> Transient Flow Structures in the <strong>Continuous</strong> <strong>Casting</strong> <strong>of</strong><br />
Steel," NSF Design & Manufacturing Grantees Conference, (Jan. 7-10, Tampa, FL), NSF,<br />
Washington, D.C., 2001, 14p.<br />
28. S. Sivaramakrishnan, H. Bai, B.G. Thomas, P. Vanka, P. Dauby, M. Assar, "Transient Flow<br />
Structures in <strong>Continuous</strong> Cast Steel," in Ironmaking Conference Proceedings, Vol. 59, ISS,<br />
Warrendale, PA, (Pittsburgh, PA), 2000, 541-557.<br />
29. S. Sivaramakrishnan, B.G. Thomas and S.P. Vanka, "Large Eddy Simulation <strong>of</strong> Turbulent Flow in<br />
<strong>Continuous</strong> <strong>Casting</strong> <strong>of</strong> Steel," in Materials Processing in the Computer Age, Vol. 3, V. Voller and H.<br />
Henein, eds., TMS, Warrendale, PA, 2000, 189-198.<br />
30. B.G. Thomas, "Modeling <strong>of</strong> the <strong>Continuous</strong> <strong>Casting</strong> <strong>of</strong> Steel: Past, Present, and Future, Dr. J. Keith<br />
Brimacombe Lecture," in Electric Furnace Conf. Proc., Vol. 59, ISS, Warrendale, PA, (Phoenix,<br />
AZ), 2001, 3-30.<br />
31. W.H. Emling, T.A. Waugaman, S.L. Feldbauer, A.W. Cramb, "Subsurface Mold Slag Entrainment<br />
in Ultra-Low Carbon Steels," in Steelmaking Conference Proceedings, Vol. 77, ISS, Warrendale,<br />
PA, (Chicago, IL), 1994, 371-379.<br />
32. R.C. Sussman, M. Burns, X. Huang, B.G. Thomas, "Inclusion Particle Behavior in a <strong>Continuous</strong><br />
Slab <strong>Casting</strong> Mold," in 10th Process Technology Conference Proc., Vol. 10, Iron and Steel Society,<br />
Warrendale, PA, (Toronto, Canada, April 5-8, 1992), 1992, 291-304.<br />
20
B.G. Thomas, Q. Yuan, L. Zhang, and S.P. Vanka, 2003 NSF Design, Service, Manufacturing and Industrial Innovation Research Conf.,<br />
Birmingham, Alabama, January 6-9, 2003<br />
33. B.G. Thomas, "Mathematical Models <strong>of</strong> <strong>Continuous</strong> <strong>Casting</strong> <strong>of</strong> Steel Slabs," Report, <strong>Continuous</strong><br />
<strong>Casting</strong> <strong>Consortium</strong>, <strong>University</strong> <strong>of</strong> Illinois at Urbana-Champaign, 1999.<br />
34. B.G. Thomas, "<strong>University</strong> - Steel Industry Interaction, R&D in the Steel Industry," 40th Congreso<br />
Latinoamericano de Siderurgia, ILAFA 40 Congress Proceedings, (Buenos Aires, Argentina), Inst.<br />
Argentino de Siderurgia, 1999, 65-67.<br />
35. Y. Miki and B.G. Thomas, "Modeling <strong>of</strong> Inclusion Removal in a Tundish," Metall. Mater. Trans. B,<br />
Vol. 30B (4), 1999, 639-654.<br />
36. B.G. Thomas, "Mathematical Models <strong>of</strong> <strong>Continuous</strong> <strong>Casting</strong> <strong>of</strong> Steel Slabs," Report, <strong>Continuous</strong><br />
<strong>Casting</strong> <strong>Consortium</strong>, <strong>University</strong> <strong>of</strong> Illinois at Urbana-Champaign, 2000.<br />
37. B.G. Thomas, "The Importance <strong>of</strong> Numercial Simulations for Further Improvements <strong>of</strong> the<br />
<strong>Continuous</strong> casting Process," 8th International <strong>Continuous</strong> <strong>Casting</strong> Conference, (Linz, Austria,<br />
August 20-25, 2000), Voest Alpine, Linz, Austria, 2000, 7.1-7.11.<br />
38. H. Bai and B.G. Thomas, "Effect <strong>of</strong> Clogging, Argon Injection, and <strong>Casting</strong> Conditions on Flow<br />
Rate and Air Aspiration in Submerged Entry Nozzles Steel," in 83rd Steelmaking Conference<br />
Proceedings, Vol. 83, ISS, Warrendale, PA, (Pittsburgh, PA, March 2-29, 2000), 2000, 183-197.<br />
39. H. Bai and B.G. Thomas, "Two-Phase Flow in Tundish Nozzles During <strong>Continuous</strong> <strong>Casting</strong> <strong>of</strong><br />
Steel," in Materials Processing in the Computer Age, Vol. 3, V. Voller and H. Henein, eds., TMS,<br />
Warrendale, PA, 2000, 85-99.<br />
40. B.G. Thomas, "<strong>Continuous</strong> <strong>Casting</strong>," in The Encyclopedia <strong>of</strong> Materials: Science and Technology,<br />
Vol. 2, D. Apelian, ed. Elsevier Science Ltd., Oxford, UK., 2001, 6p.<br />
41. B.G. Thomas, "Fundamentals <strong>of</strong> <strong>Continuous</strong> <strong>Casting</strong>: Modeling," in Making, Shaping and Treating<br />
<strong>of</strong> Steel: <strong>Continuous</strong> <strong>Casting</strong>, Vol. 5, A. Cramb, ed. AISE Steel Foundation, Pittsburgh, PA, 2001,<br />
Chapter 3.9, submitted Oct., 2000.<br />
42. B.G. Thomas, "<strong>Continuous</strong> <strong>Casting</strong> Operation: Fluid Flow," in Making, Shaping and Treating <strong>of</strong><br />
Steel: <strong>Continuous</strong> <strong>Casting</strong>, Vol. 5, A. Cramb, ed. AISE Steel Foundation, Pittsburgh, PA, 2001,<br />
Chapter 4.3, submitted Oct., 2000.<br />
43. B.G. Thomas, "<strong>Continuous</strong> <strong>Casting</strong> <strong>of</strong> Steel, Chap. 15," in Modeling and Simulation for <strong>Casting</strong> and<br />
Solidification: Theory and Applications, O. Yu, ed. Marcel Dekker, New York, 2001, in press.<br />
44. T. Shi and B.G. Thomas, "Effect <strong>of</strong> Gas Bubble Size on Fluid Flow in <strong>Continuous</strong> <strong>Casting</strong> Mold,"<br />
Report, <strong>Continuous</strong> <strong>Casting</strong> <strong>Consortium</strong>, 2001.<br />
45. Q. Yuan, S.P. Vanka and B.G. Thomas, "Large Eddy Simulations <strong>of</strong> Turbulent Flow and Inclusion<br />
Transport in <strong>Continuous</strong> <strong>Casting</strong> <strong>of</strong> Steel," 2nd International Symposium on Turbulent and Shear<br />
Flow Phenomena, June 27 - 29, 2001, Royal Insitute <strong>of</strong> Technology(KTH), Stockholm, Sweden,<br />
2001, 6.<br />
21
B.G. Thomas, Q. Yuan, L. Zhang, and S.P. Vanka, 2003 NSF Design, Service, Manufacturing and Industrial Innovation Research Conf.,<br />
Birmingham, Alabama, January 6-9, 2003<br />
46. C. Bernhard, B.G. Thomas, G. Xia, C. Chimani, "Simulation <strong>of</strong> Solidification and Microstructure in<br />
<strong>Continuous</strong> <strong>Casting</strong>," Berg- und Huettenmaennische Monatshefte, 2001, submitted, June, 2001.<br />
47. Q. Yuan, S.P. Vanka and B.G. Thomas, "Large Eddy Simulations <strong>of</strong> Turbulent Flow and Inclusion<br />
Transport in <strong>Continuous</strong> <strong>Casting</strong> <strong>of</strong> Steel," 2nd International Symposium on Turbulent and Shear<br />
Flow Phenomena, June 27 - 29, 2001, Royal Institute <strong>of</strong> Technology (KTH), Stockholm, Sweden,<br />
Vol. 2, 2001, 519-524.<br />
48. Q. Yuan, T. Shi, B.G. Thomas, S.P. Vanka, "Simulation <strong>of</strong> Fluid Flow in the <strong>Continuous</strong> <strong>Casting</strong> <strong>of</strong><br />
Steel," Computational Modeling <strong>of</strong> Materials, Minerals and Metals Processing, (Seattle, CA, Feb.<br />
18-20, 2002), TMS, Warrendale, PA, 2001, 491-500.<br />
49. B.G. Thomas, "<strong>Continuous</strong> <strong>Casting</strong>: Complex Models," in The Encyclopedia <strong>of</strong> Materials: Science<br />
and Technology, Vol. 2, K.H. J. Buschow, R. Cahn, M. Flemings, B. Ilschner, E. J. Kramer, S.<br />
Mahajan and s.e. J. Dantzig, eds., Elsevier Science Ltd., Oxford, UK, 2001, 1599-1609.<br />
50. B.G. Thomas and L. Zhang, "Mathematical Modeling <strong>of</strong> Fluid Flow in <strong>Continuous</strong> <strong>Casting</strong>: a<br />
Review," ISIJ Internat., Vol. 41 (10), 2001, 1185-1197.<br />
51. B.G. Thomas, Q. Yuan, S. Sivaramakrishnan, T. Shi, S.P. Vanka, M.B. Assar, "Comparison <strong>of</strong> Four<br />
Methods to Evaluate Fluid Velocities in a <strong>Continuous</strong> <strong>Casting</strong> Mold," ISIJ Internat., Vol. 41 (10),<br />
2001, 1266-1276.<br />
52. B.G. Thomas, Q. Yuan, S. Sivaramakrishnan, T. Shi, S.P. Vanka, M.B. Assar, "Comparison <strong>of</strong> Four<br />
Methods to Evaluate Fluid Velocities in a <strong>Continuous</strong> <strong>Casting</strong> Mold," ISIJ Int., Vol. 41 (10), 2001,<br />
1262-1272.<br />
53. P. Andrzejewski, D. Gotthelf, E. Julius, H. Haubrich, "Mould Flow Monitoring at No. 3 Slab Caster,<br />
Krupp Hoesch Stahl AG," in Steelmaking Conference Proceedings, Vol. 80, ISS, Warrendale, PA,<br />
1997, (Chicago, IL), 1997, 153-157.<br />
54. B.G. Thomas, R.J. O'Malley and D.T. Stone, "Measurement <strong>of</strong> temperature, solidification, and<br />
microstructure in a continuous cast thin slab," Modeling <strong>of</strong> <strong>Casting</strong>, Welding, and Advanced<br />
Solidification Processes, (San Diego, CA), TMS, Warrendale, PA, Vol. VIII, 1998, 1185-1199.<br />
55. CFX 4.2, Report, AEA Technology, 1700 N. Highland Rd., Suite 400, Pittsburgh, PA 15241, 1998.<br />
56. H. Bai, "Argon Bubble Behavior in Slide-Gate Tundish Nozzles During <strong>Continuous</strong> <strong>Casting</strong> <strong>of</strong> Steel<br />
Slabs," PhD Thesis, <strong>University</strong> <strong>of</strong> Illinois, 2000.<br />
57. E.T. Turkdogan, "Deoxidation <strong>of</strong> Steel," JISI, 1972, 21-36.<br />
58. R.A. Rege, E.S. Szekeres and W.D. Forgeng, "Three-Dimensional View <strong>of</strong> Alumina Clusters in<br />
Aluminum-Killed Low-Carbon Steel," Met. Trans. AIME, Vol. 1 (9), 1970, 2652.<br />
59. K. Okohira, N. Sato and H. Mori, "Observation <strong>of</strong> Three-Dimensional Shapes <strong>of</strong> Inclusions in Low-<br />
Carbon Aluminum-Killed Steel by Scanning Electron Microscope," Trans. ISIJ, Vol. 14, 1974, 103-<br />
109.<br />
22
B.G. Thomas, Q. Yuan, L. Zhang, and S.P. Vanka, 2003 NSF Design, Service, Manufacturing and Industrial Innovation Research Conf.,<br />
Birmingham, Alabama, January 6-9, 2003<br />
60. R. Rastogi and A.W. Cramb, "Inclusion Formation and Agglomeration in Aluminum-killed Steels,"<br />
in 2001 Steelmaking Conference Proceedings, Vol. 84, ISS, Warrendale, (Baltimore, Maryland,<br />
USA), 2001, 789-829.<br />
61. M. Olette, "Institut de Recherches de La Siderurgie Francaise," Report, IRSIO, 1972.<br />
62. K. Asano and T. Nakano, "Deoxidation <strong>of</strong> Molten Steel with Deoxidizer," Trans. ISIJ, Vol. 12,<br />
1972, 343-349.<br />
63. H. Ooi, T. Sekine and G. Kasai, "On the Mechanisms <strong>of</strong> Alunima Cluster Formation in Molten<br />
Iron," Trans. ISIJ, Vol. 15, 1975, 371-379.<br />
64. N. Aritomi and K. Gunji, "Morphology and Formation Mechanism <strong>of</strong> Dendritic Inclusions in Iron<br />
and Iron-Nickel Alloys Deoxidized with Silicon and Solidified Unidirectionally," Trans. ISIJ, Vol.<br />
19, 1979, 152-161.<br />
65. T.B. Braun, J.F. Elliott and M.C. Flemings, "The Clustering <strong>of</strong> Alumina Inclusions," Metal. Trans.<br />
B, Vol. 10B (6), 1979, 171-184.<br />
66. N. Aritomi and K. Gunji, "On the Formation <strong>of</strong> Dendritic Inclusion from a Spherical Primary Silica<br />
in Iron-10% Nickel Alloy Deoxidized with Silicon," Trans. ISIJ, Vol. 20, 1980, 26-32.<br />
67. Y. Miki, H. Kitaoka, T. Sakuraya, T. Fujii, "Mechanism for Separating Inclusions from Molten Steel<br />
Stirred with a Rotating Electro-Magnetic Field," ISIJ Inter., Vol. 32 (1), 1992, 142-149.<br />
68. W.K. Tiekink, A. Pieters and J. Hekkema, "Al2O3 in Steel: Morphology Dependent on Treatment,"<br />
I & Smaker, Vol. 21 (7), 1994, 39-41.<br />
69. T. Murai, H. Matsuno, E. Sakurai, H. Kawashima, "Separation Mechanism <strong>of</strong> Inclusion from Molten<br />
Steel during RH Treatment," Tetsu-to-Hagane, Vol. 84 (1), 1998, 13-18.<br />
70. L. Zhang and S. Taniguchi, "Fluid Flow and Inclusion Removal in <strong>Continuous</strong> <strong>Casting</strong> Tundish,"<br />
Metal. & Material Trans. B., Vol. 31B (2), 2000, 253-266.<br />
71. K. Nakanishi and J. Szekely, "Deoxidation Kinetics in a Turbulent Flow Field," Trans. ISIJ, Vol. 15,<br />
1975, 522-530.<br />
72. L. Kampmann and M. Kahlweit, "On the Theory <strong>of</strong> Precipitations II," Berichte der Bunsen-<br />
Gesellschaft physikalische Chemie, Vol. 74 (5), 1970, 456-462.<br />
73. F. Oeters, Metallurgy <strong>of</strong> Steelmaking, Verlag Stahleisen mbH, 1994, 347.<br />
74. T. Kawawa and M. Ohkubo, "A Kinetics on Deoxidation <strong>of</strong> Steel," Trans. ISIJ, Vol. 8, 1968, 203-<br />
219.<br />
75. K. Ogawa, "Slag Refining for Production <strong>of</strong> Clean Steel," in Nishiyama Memorial Seminar, Vol.<br />
143/144, Iron and Steel Institute <strong>of</strong> Japan, (ISS, Tokyo), 1992, 137-166.<br />
23
B.G. Thomas, Q. Yuan, L. Zhang, and S.P. Vanka, 2003 NSF Design, Service, Manufacturing and Industrial Innovation Research Conf.,<br />
Birmingham, Alabama, January 6-9, 2003<br />
76. M. Matsuno, Y. Kikuchi, M. Komatsu, M. Arai, K. Watanabe, H. Nakashima, "Development <strong>of</strong> New<br />
Deoxidation Technique for RH Degassers," I & Smaker, Vol. 20 (7), 1993, 35-38.<br />
77. D. Reay and G.A. Ratcliff, The Canadian J. <strong>of</strong> Chem. Eng., Vol. 51, 1973, 178-185.<br />
78. J.R. Grace, Trans. Inst. Chem. Eng., Vol. 54, 1976, 167-173.<br />
79. T. Tadaki and S. Maeda, Chemical Engineering (In Japanese), Vol. 25 (4), 1961, 254-264.<br />
80. V.G. Levich, "Physicochemical Hydrodynamics," in Physicochemical Hydrodynamics, Englewood<br />
Cliff: Prentice Hall London, 1962, 209,216,224,395-470.<br />
81. F.N. Peebles and H.J. Garber, Chem. Eng. Prog., Vol. 49, 1953, 88.<br />
82. R. Clift, J.R. Grace and M.E. Weber, Bubbles, Drops and Particles, Academics Press, INC., New<br />
York, 1978.<br />
83. R.M. Davies and G. Taylor, Proc. R. Soc. London Ser., Vol. A200, 1950, 375-390.<br />
84. B.G. Thomas, L.J. Mika and F.M. Najjar, "Simulation <strong>of</strong> Fluid Flow Inside a <strong>Continuous</strong> Slab<br />
<strong>Casting</strong> Machine," Metall. Trans. B, Vol. 21B (2), 1990, 387-400.<br />
85. T.C. Hsiao, T. Lehner and B. Kjellberg, Scand. J. Metallurgy, Vol. 8, 1980, 105.<br />
86. M. Sevik and S.H. Park, J. <strong>of</strong> Fluids Eng. Trans. AIME (53-60), 1973,<br />
24
copper<br />
mold<br />
Resolidified<br />
Flux<br />
Oscillation<br />
Mark<br />
Contact<br />
Resistances<br />
Air Gap<br />
Nozzle<br />
Nozzle<br />
Support<br />
Roll<br />
Water<br />
Spray<br />
Roll<br />
Flux<br />
Rim<br />
Submerged Entry Nozzle<br />
Flux Powder<br />
Ferrostatic<br />
Pressure<br />
Roll Contact<br />
entrainment<br />
Molten Steel Pool<br />
Solidifying Steel<br />
Shell<br />
Bulging<br />
Liquid Flux<br />
argon<br />
bubbles<br />
nozzle<br />
port<br />
jet<br />
Inclusion<br />
particles and<br />
bubbles<br />
Figure 1. .Schematic <strong>of</strong> Flow Phenomena in<br />
Mold Region <strong>of</strong> <strong>Continuous</strong> <strong>Casting</strong> Process.<br />
(a)<br />
CL<br />
25<br />
Figure 2. Schematic <strong>of</strong> the<br />
computational domain.<br />
Figure 3. Velocity field at the center plane between wide faces (a) time averaged plot, (b)<br />
a typical instantaneous plot.<br />
(b)
(u 2 +v 2 ) 1/2 (m/s)<br />
1.6<br />
1.4<br />
1.2<br />
1<br />
0.8<br />
0.6<br />
0.4<br />
0.2<br />
SEN<br />
0<br />
0 0.05 0.1 0.15 0.2 0.25<br />
x(m)<br />
0.3 0.35 0.4 0.45<br />
26<br />
Water Model (LES)<br />
<strong>Casting</strong> Machine (LES)<br />
Dye injection measurement<br />
Figure 4. Comparison <strong>of</strong> (u 2 + v 2 ) 1/2 along jet centerline, obtained from LES and dye<br />
injection measurements (full-scale water model).<br />
w(m/s)<br />
0.07<br />
0.06<br />
0.05<br />
0.04<br />
0.03<br />
0.02<br />
0.01<br />
0<br />
-0.01<br />
-0.02<br />
Caster, Right<br />
Caster, Left<br />
Water Model, Right<br />
Water Model, Left<br />
Solid shell at cating speed<br />
-0.06 -0.04 -0.02 0 0.02 0.04 0.06<br />
y(m)<br />
Figure 5. Comparison <strong>of</strong> downwards velocities<br />
<strong>of</strong> the full scale water and casting machine along<br />
a horizontal line.<br />
w rms (m/s)<br />
0.08<br />
0.07<br />
0.06<br />
0.05<br />
0.04<br />
0.03<br />
0.02<br />
0.01<br />
0<br />
<strong>Casting</strong> Machine, Right<br />
<strong>Casting</strong> Machine, Left<br />
Water Model, Right<br />
Water Model, Left<br />
-0.06 -0.04 -0.02 0<br />
y(m)<br />
0.02 0.04 0.06<br />
Figure 6. Comparison <strong>of</strong> rms <strong>of</strong> the downwards<br />
velocity <strong>of</strong> the full scale water and casting<br />
machine along a horizontal line.
Figure 7. Time variation <strong>of</strong> horizontal velocity towards SEN at the center points <strong>of</strong> the<br />
two sides <strong>of</strong> the top surface.<br />
h(mm)<br />
8<br />
6<br />
4<br />
2<br />
0<br />
-2<br />
-4<br />
-6<br />
-8<br />
-0.4 -0.2 0 0.2 0.4<br />
x(m)<br />
Figure 8. A typical top level fluctuation approximated from the computed pressure by<br />
( p−pmean )<br />
(<br />
), obtained from LES.<br />
ρ − ρ g<br />
( steel flux )<br />
27<br />
SEN<br />
t= 20.3s
Figure 9. Particle distributions at three instants (blue dots are moving particles; red dots<br />
are entrapped particles by solidifying shell).<br />
Figure 10. Time variation <strong>of</strong> downwards velocity at two points showing inherent<br />
transient asymmetry <strong>of</strong> the lower rolls.<br />
28
Figure 11. Instantaneous velocity vector (left) and temperature contour (right) plots.<br />
29
Frequency (%)<br />
50<br />
40<br />
30<br />
20<br />
10<br />
K O (min - 1 )<br />
0<br />
0 1 2 3 4 5 6 7 8 9<br />
Diameter <strong>of</strong> first arm, second arm or<br />
separate particles in cluster ( µm )<br />
Figure 12. The smallest size feature <strong>of</strong><br />
alumina inclusions in Steel<br />
10 0<br />
10 -1<br />
10 -2<br />
10 -3<br />
10 0<br />
Ar gas bubbling ASEA-SKF (I)<br />
ASEA-SKF (II) VOD (NK-PERM)<br />
VOD (Convent.) RH (NK-PERM)<br />
RH (Convent.)<br />
10 1<br />
d[O]/dt=K o [O]<br />
- 1<br />
[O]: ppm; t: min; K : min O<br />
10 2<br />
10 3<br />
10 4<br />
Stirring power (Watt/ton)<br />
Figure 14. Effect <strong>of</strong> stirring power on<br />
deoxidation rate constant<br />
N i (m -3 )<br />
N i (m -3 )<br />
30<br />
N i (m -3 )<br />
10 18<br />
10 15<br />
10 12<br />
10 9<br />
10 6<br />
10 3<br />
10 0<br />
10 15<br />
10 12<br />
10 9<br />
10 6<br />
10 3<br />
10 0<br />
t (s)<br />
1<br />
6<br />
100<br />
0.1 1 10<br />
r (µm) i<br />
Figure 13. Inclusion size distribution as<br />
a function <strong>of</strong> time<br />
t=150s<br />
Stirring power (Watt/ton)<br />
1 10<br />
100 1000<br />
0.1 1 10 100 1000<br />
r i (µm)<br />
Figure 15. Effect <strong>of</strong> stirring power<br />
on inclusion size distribution<br />
40
U B ( m/s )<br />
10 1<br />
10 0<br />
10 -1<br />
1 J.R.Grace [28]<br />
2 V.G.Levich [30]<br />
3 F.N.Peebles [31]<br />
4 R.M.Davies [33]<br />
5 R.Clift [32]<br />
6 mean value<br />
5<br />
10<br />
0.1 1 10 100<br />
-2<br />
31<br />
3<br />
The value <strong>of</strong> industri<br />
production,<br />
d B =9~19mm<br />
u B =0.33~0.43m/s<br />
6 4<br />
2 1<br />
d B ( mm)<br />
Figure 16. Terminal velocities <strong>of</strong> gas bubbles in liquid steel as a function <strong>of</strong> bubble size<br />
uB<br />
Bubble<br />
uP<br />
dOC , SOC<br />
Figure 17. Schematic <strong>of</strong> collision and adhesion <strong>of</strong> inclusions on a bubble<br />
θC<br />
Inclusion
Stream Function Distribution<br />
Inclusion density: 7120 kg/m 3<br />
Collision Probability, P C (10 - 3 )<br />
250<br />
200<br />
150<br />
100<br />
50<br />
0<br />
Experiment<br />
Fluent (Trjectory calculation,BC: zero shear)<br />
Fluent (Trjectory calculation,BC: no slip)<br />
Analytical (Streamline|Potential flow)<br />
Fluent (Streamline|Real flow, BC:zero shear)<br />
0 10 20 30 40 50 60 70<br />
d p (µm)<br />
Figure 19. Comparison <strong>of</strong> measured probability <strong>of</strong> collision between silica particles and air bubbles in water with various<br />
mathematical models<br />
32<br />
Inclusion density: 2800 kg/m 3<br />
clusion density: 14400 kg/m 3<br />
Figure 18. The trajectory and attachment around a bubble <strong>of</strong> 100 µm inclusions with different<br />
density compared to the streamline distribution
Collision Probability (%)<br />
10 2<br />
10 1<br />
10 0<br />
10 -1<br />
10 -2<br />
10 100<br />
33<br />
d B =1mm<br />
d p (µm)<br />
d B =5mm<br />
Figure 20. Collision probabilities calculated between argon bubble and alumina inclusions in liquid steel<br />
d Bmax (mm)<br />
10<br />
45<br />
2<br />
100<br />
4<br />
1000<br />
40 3<br />
1<br />
5<br />
35<br />
30<br />
25<br />
20<br />
15<br />
10<br />
5<br />
6<br />
We Crit =0.59<br />
We Crit =1.0<br />
1. SEN outlet <strong>of</strong> continuous<br />
casting mold [74]<br />
2. RH [76]<br />
3. VOD [77]<br />
4. ASEA-SKF [77]<br />
5. Tundish inlet zone [78]<br />
6. 50t ladles [79]<br />
0<br />
10 100 1000<br />
ε (W/t)<br />
2000<br />
2000<br />
Figure 21. The relationship between the stirring intensity and bubble size
Number <strong>of</strong> Al 2 O 3 inclusion (1/m 3 )<br />
10 12<br />
10 10<br />
10 8<br />
10 6<br />
10 4<br />
10 2<br />
10 0<br />
Microinclusion (1/mm 2 area)<br />
Tundish sample above outlet<br />
Slab (surface 20mm)<br />
Slab (mean <strong>of</strong> inner<br />
and outer radius)<br />
0 20 40 60 80 100 120 140<br />
d p (µm)<br />
34<br />
Al 2 O 3 amount (ppm)<br />
7<br />
6<br />
5<br />
4<br />
3<br />
2<br />
1<br />
0<br />
-1<br />
Tundish sample above outlet<br />
Slab (surface 20mm)<br />
Slab (mean <strong>of</strong> inner<br />
and outer radius)<br />
0 20 40 60 80 100 120 140<br />
d p (µm)<br />
Figure 22. Inclusion size distribution for samples in tundish and slab<br />
10<br />
9<br />
8<br />
7<br />
6<br />
5<br />
4<br />
3<br />
2<br />
1<br />
Solidified shell thickness (mm)<br />
13<br />
28<br />
1/4 width<br />
1/2 width<br />
28 13<br />
0 50 100 150 200 250<br />
Slab thickness from inner radius to outer radius (mm)<br />
Figure 23. Inclusion distribution along the slab thickness <strong>of</strong> continuous casting slab
Domain depth (m)<br />
0.0<br />
0.5<br />
1.0<br />
1.5<br />
2.0<br />
2.5<br />
Half mold width (m)<br />
0.0 0.2 0.4 0.6<br />
Figure 24. The simulated entrapped 50 µm inclusion positions on wide face<br />
35<br />
13-15mm shell<br />
thickness<br />
28mm shell thickness