a PDF version - Continuous Casting Consortium - University of ...
a PDF version - Continuous Casting Consortium - University of ...
a PDF version - Continuous Casting Consortium - University of ...

You also want an ePaper? Increase the reach of your titles
YUMPU automatically turns print PDFs into web optimized ePapers that Google loves.
Thermomechanical Finite-Element Model <strong>of</strong> Shell Behavior<br />
in <strong>Continuous</strong> <strong>Casting</strong> <strong>of</strong> Steel<br />
CHUNSHENG LI and BRIAN G. THOMAS<br />
A coupled finite-element model, CON2D, has been developed to simulate temperature, stress, and shape<br />
development during the continuous casting <strong>of</strong> steel, both in and below the mold. The model simulates a<br />
transverse section <strong>of</strong> the strand in generalized plane strain as it moves down at the casting speed. It<br />
includes the effects <strong>of</strong> heat conduction, solidification, nonuniform superheat dissipation due to turbulent<br />
fluid flow, mutual dependence <strong>of</strong> the heat transfer and shrinkage on the size <strong>of</strong> the interfacial gap, the taper<br />
<strong>of</strong> the mold wall, and the thermal distortion <strong>of</strong> the mold. The stress model features an elastic-viscoplastic<br />
creep constitutive equation that accounts for the different responses <strong>of</strong> the liquid, semisolid, delta-ferrite,<br />
and austenite phases. Functions depending on temperature and composition are employed for properties<br />
such as thermal linear expansion. A contact algorithm is used to prevent penetration <strong>of</strong> the shell into the<br />
mold wall due to the internal liquid pressure. An efficient two-step algorithm is used to integrate these<br />
highly nonlinear equations. The model is validated with an analytical solution for both temperature and<br />
stress in a solidifying slab. It is applied to simulate continuous casting <strong>of</strong> a 120 mm billet and compares<br />
favorably with plant measurements <strong>of</strong> mold wall temperature, total heat removal, and shell thickness,<br />
including thinning <strong>of</strong> the corner. The model is ready to investigate issues in continuous casting such as<br />
mold taper optimization, minimum shell thickness to avoid breakouts, and maximum casting speed to<br />
avoid hot-tear crack formation due to submold bulging.<br />
I. INTRODUCTION<br />
COMPUTATIONAL models are important tools to gain<br />
insight into thermal and mechanical behavior during complex<br />
manufacturing processes such as the continuous casting <strong>of</strong><br />
steel billets. This process features many interacting phenomena<br />
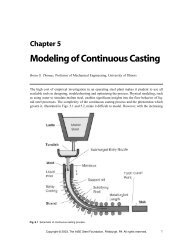
which challenge modeling methods, shown in Figure 1(a).<br />
Starting with the turbulent flow <strong>of</strong> molten steel into the mold<br />
cavity, superheat is dissipated during flow recirculation in<br />
the liquid pool prior to solidifying a shell against the walls<br />
<strong>of</strong> a water-cooled copper mold. Heat transfer is controlled<br />
by conduction through the solidifying steel shell, the mold,<br />
and, especially, the size and properties <strong>of</strong> the interfacial<br />
layers between them. After initial solidification at the meniscus,<br />
the shell tends to shrink away from the mold walls due<br />
to thermal contraction. Over most <strong>of</strong> the strand surface, internal<br />
“ferrostatic pressure” from the head <strong>of</strong> molten metal maintains<br />
good contact between the shell and the mold. However,<br />
shrinkage near the corners may create gaps or intermittent<br />
contact, which greatly lowers the local cooling rate. The<br />
extent <strong>of</strong> the gap depends on the composition-dependent<br />
shrinkage <strong>of</strong> the steel shell, its creep resistance, the casting<br />
speed, taper <strong>of</strong> the mold wall, thermal distortion <strong>of</strong> the mold<br />
wall, and the thermal properties <strong>of</strong> the material filling<br />
the interfacial gap. The mechanical behavior <strong>of</strong> the shell<br />
also controls the formation <strong>of</strong> defects such as hot-tear<br />
cracks and breakouts and depends on thermal shrinkage,<br />
high-temperature inelastic stress-generation rate, solid-state<br />
phase transformations, temperature, steel composition, mul-<br />
CHUNSHENG LI, Postdoctoral Student, and BRIAN G. THOMAS,<br />
Wilkins Pr<strong>of</strong>essor <strong>of</strong> Mechanical Engineering, are with the Department <strong>of</strong><br />
Mechanical and Industrial Engineering, <strong>University</strong> <strong>of</strong> Illinois at Urbana-<br />
Champaign, Urbana, IL 61801. Contact e-mail: bgthomas@uiuc.edu<br />
Manuscript submitted August 18, 2003.<br />
tidimensional stress state, and deformation rate. The harsh<br />
environment <strong>of</strong> the steel plant makes it difficult to conduct<br />
experiments during the process. To improve insight into<br />
these phenomena demands sophisticated mathematical models,<br />
to aid the traditional tools <strong>of</strong> physical models, lab, and<br />
plant experiments.<br />
A thermal-mechanical finite-element model that incorporates<br />
the aforementioned phenomena, named CON2D, has<br />
been developed in the Metals Processing Simulation Laboratory<br />
at the <strong>University</strong> <strong>of</strong> Illinois at Urbana-Champaign over<br />
the past decade [1–4] with several applications. [5–12] After a<br />
brief literature review, this article describes the features <strong>of</strong><br />
the CON2D model. It then presents its validation with analytical<br />
solutions and a simulation <strong>of</strong> a continuous steel billet<br />
casting process, where plant measurements were available<br />
for comparison.<br />
II. PREVIOUS WORK<br />
Many previous computational models have investigated<br />
thermal stress during the continuous casting <strong>of</strong> steel, including<br />
models <strong>of</strong> billet casting, [13–19] beam blanks, [20] slab casting,<br />
[2,6,11,13,14,21–31] and thin-slab casting. [32,33,34] Brimacombe,<br />
Grill, and co-workers first applied computational thermalstress<br />
models <strong>of</strong> a two-dimensional (2-D) billet section under<br />
plane stress [13,14] as it moved down the caster. These and<br />
similar early models [21,22,23] revealed important insights into<br />
crack formation, such as the need to avoid reheating. This<br />
infant stage <strong>of</strong> computational stress modeling was qualitative<br />
due to the lack <strong>of</strong> material properties at high temperature,<br />
a simple elastic-plastic constitutive model, and coarse<br />
meshes due to computer limitations.<br />
Rammerstorfer et al. added a separate creep function in<br />
developing a thermoviscoelastic-plastic stress model <strong>of</strong> a<br />
transient one-dimensional (1-D) slice domain through a<br />
METALLURGICAL AND MATERIALS TRANSACTIONS B VOLUME 35B, DECEMBER 2004—1151
(a)<br />
(b)<br />
(c)<br />
Fig. 1—Modeling domain <strong>of</strong> casting billet: (a) schematic <strong>of</strong> billet casting, (b)<br />
L-shaped mess <strong>of</strong> three-node heat-transfer elements (shown) connected into sixnode<br />
stress elements, and (c) schematic <strong>of</strong> slice domain at the billet centerline.<br />
slab. [24] Kristiansson [15] advanced the traveling-slice model<br />
with stepwise coupling <strong>of</strong> the thermal and stress computations<br />
within a 2-D billet section, based on the interfacial gap<br />
between the mold and shell. This model also featured different<br />
creep constants for modeling austenite and -ferrite and<br />
temperature-dependent properties. Similar models were developed<br />
for slab sections, [26] including some that assumed plane<br />
strain. [27] Kelly et al. [16] developed an axisymmetric model<br />
<strong>of</strong> coupled thermal stress in round billets to study the effect<br />
<strong>of</strong> carbon content on the formation <strong>of</strong> longitudinal cracks.<br />
Elastic-stress analysis was performed on the mold and the<br />
billet to determine the interfacial-gap pr<strong>of</strong>ile, followed by<br />
elastic-plastic stress analysis <strong>of</strong> the billet.<br />
Recently, several improved models <strong>of</strong> the thermal-mechanical<br />
behavior <strong>of</strong> continuous-cast steel have been developed.<br />
Boehmer et al. [17] coupled a three-dimensional (3-D) in-house<br />
heat-flow model and a 2-D thermal-stress model in the<br />
ADINA model, to analyze a continuous-cast billet section<br />
in plane stress. An elastoplastic constitutive model was<br />
adopted, including strain-rate-dependent strength and plasticity,<br />
and a separate creep model, if necessary. The solidifying<br />
solid was discretized with a deforming grid, and liquid<br />
elements were deleted from the stress simulation.<br />
A transverse-slice model, AMEC2D, was developed to simulate<br />
beam-blank casting, including elastic-viscoplastic behavior<br />
and a simple fluid-flow model to account for superheat transport<br />
in the liquid pool. [20] Park et al. applied AMEC2D to<br />
investigate the effect <strong>of</strong> mold-corner radius on shell growth<br />
and longitudinal corner cracks in billets. [18] This model<br />
assumed plane stress and neglected the effects <strong>of</strong> superheat<br />
variations.<br />
Huespe et al. developed the Arbitrary Lagrangian-Eulerian [31]<br />
and mixed Eulerian-Lagrangian [19] thermal-mechanical models,<br />
to analyze stress/strain distributions in continuous-cast round<br />
steel billets. These rigorous models adopt elastic-viscoplastic<br />
material behavior with temperature- and history-dependent material<br />
parameters, but are computationally intensive and assume<br />
2-D axisymmetry. They show that the generalized plane-strain<br />
assumption matches closest to the real behavior, short <strong>of</strong> a full<br />
3-D analysis.<br />
Many important related aspects <strong>of</strong> continuous casting have<br />
been modeled in depth and are discussed elsewhere, [35,36]<br />
including fluid flow in the molten steel pool, [37] nonequilibrium<br />
solidification <strong>of</strong> the shell, [35,38] thermal distortion<br />
<strong>of</strong> the mold, [39] bulging and bending <strong>of</strong> the strand below<br />
the mold, [40,41] and crack prediction. [35,42]<br />
Although they have generated important insights, previous<br />
thermal-mechanical models <strong>of</strong> shell solidification in the mold<br />
still oversimplify some phenomena or are too computationally<br />
expensive to simulate large-scale problems with sufficient<br />
mesh and time-step refinement to be accurate. There<br />
is still a need for better models to gain more quantitative<br />
insight into thermal-mechanical behavior and crack prediction<br />
in continuous casting <strong>of</strong> steel.<br />
III. GOVERNING EQUATIONS<br />
The model solves the transient heat-conduction equation<br />
and corresponding force-equilibrium equation for temperature,<br />
displacement, strain, and stress in a transverse Lagrangian<br />
reference frame moving downward with the steel shell at the<br />
casting speed, as shown in Figure 1(a). Both 2-D and 1-D<br />
slice domains are simulated, as shown in Figures 1(b) and (c),<br />
respectively.<br />
1152—VOLUME 35B, DECEMBER 2004 METALLURGICAL AND MATERIALS TRANSACTIONS B
A. Heat-Transfer and Solidification Model<br />
The model first solves the transient energy balance (Eq. [1]),<br />
where H(T) and k(T) are the isotropic temperature-dependent<br />
enthalpy and conductivity, respectively. [43]<br />
[1]<br />
A 2-D simplification <strong>of</strong> the full 3-D process is reasonable,<br />
because axial (z direction) heat conduction is negligible<br />
relative to advection at the high Péclet number <strong>of</strong> this<br />
steel continuous casting process (vL/ 2 103 H (T)<br />
r<br />
T<br />
).*<br />
§ # (k(T )§T )<br />
*v 0.0167 m/s, L 1 m, 7500 kg/m 3 , c p 0.6 kJ/kgK, K <br />
40 W/mK.<br />
Applying the chain rule to the left-hand side <strong>of</strong> Eq. [1]<br />
isolates the specific heat (c p) and latent heat (L f) together in<br />
a convenient function, ∂H(T)/∂T, in Eq. [2]. Heat-balance<br />
numerical errors are lessened by providing an enthalpytemperature<br />
look-up function.<br />
H(T )<br />
ra<br />
T baT<br />
t<br />
<br />
b ak (T )<br />
x<br />
Boundary conditions can be a fixed temperature, heat flux,<br />
convection, or a heat-resistor model across the interfacial<br />
layer between the mold wall and the steel surface. [43] The<br />
latter enables the fully coupled heat-transfer and stress analysis<br />
described in Section VII–C. The thermal-property functions<br />
<strong>of</strong> different steels, including conductivity and enthalpy,<br />
are given in Section X–B.<br />
B. Stress Model<br />
The general governing equation for the static-mechanics<br />
problem in this Lagrangian frame is given by the forceequilibrium<br />
balance in Eq. [3]. [44]<br />
[3]<br />
Below the meniscus region, axial temperature gradients and<br />
the corresponding displacement gradients are generally small,<br />
so it is reasonable to apply a generalized plane-strain assumption<br />
in the casting direction. This enables a 2-D transientstress<br />
analysis to provide a reasonable approximation <strong>of</strong> the<br />
complete 3-D stress state. Although this is not quite as accurate<br />
as a fully 3-D analysis, [31] §<br />
this slice-model approach can<br />
realistically model the entire continuous casting process, with<br />
the possible exception <strong>of</strong> the meniscus region, at a relatively<br />
small computational cost.<br />
The incremental governing equations acting over each<br />
time step (t), for the generalized plane-strain condition,<br />
simplify Eq. [3] to the following:<br />
# s rb 0 <br />
s x<br />
sy y<br />
∫ sz dA Fz t x<br />
xy<br />
0<br />
x txy 0<br />
y<br />
∫xs z dA M x<br />
∫ys z dA M y<br />
T <br />
b ak(T )T<br />
x y y b<br />
[2]<br />
[4]<br />
Incremental total strains {} are related to displacements<br />
{u x, u y, u z} according to Eq. [5].<br />
There are no body forces, because the ferrostatic pressure<br />
caused by gravity acting on the liquid is instead applied<br />
through the internal boundary conditions described in Section<br />
IX–B. Besides the regular boundary conditions like fixed<br />
displacements and surface tractions, a special type <strong>of</strong> boundary,<br />
mold-wall constraint, is included in CON2D to model<br />
the interactions between the mold wall and the steel surface,<br />
as addressed in Section VIII–B. The distorted shape <strong>of</strong> the<br />
mold has an important influence on the size <strong>of</strong> the interfacial<br />
gap, heat transfer, and, consequently, stress, and so is incorporated<br />
as discussed in Section VIII–A.<br />
Tw<strong>of</strong>old symmetry can be assumed in the current continuous<br />
casting application, so the constants related to bending<br />
(b and c in Eq. [5] and M x and M y in Eq. [4]) all vanish,<br />
and z represents the unconstrained axial (thickness) contraction<br />
<strong>of</strong> each 2-D slice.<br />
IV. CONSTITUTIVE MODELS<br />
Increments <strong>of</strong> stress and elastic strain are related through<br />
Hook’s Law (Eq. [6]). Matrix [D] contains the isotropic<br />
temperature-dependent elastic modulus (E(T)), and Poisson’s<br />
ratio (), given in Eq. [7].<br />
where {} { x y xy z} T {} { x y xy z} T<br />
1v v 0 v<br />
v 1v 0 v<br />
E<br />
0 0<br />
12v<br />
2 0<br />
U<br />
v v 0 1v<br />
The incremental total strains ({}) in Eq. [5] are composed<br />
<strong>of</strong> elastic ({ e}), thermal, ({ th}), inelastic ({ in}),<br />
and flow ({ flow}) strain components, as given in Eq. [8].<br />
{} { e} { th} { in} { flow}<br />
The totals <strong>of</strong> all strains at a given time (t t) are<br />
obtained by accumulating the strain increments at each prior<br />
time step. For example, the total strain is accumulated as<br />
follows (Eq. [9]):<br />
{ tt } { t } { tt }<br />
METALLURGICAL AND MATERIALS TRANSACTIONS B VOLUME 35B, DECEMBER 2004—1153<br />
[D] <br />
x u x<br />
x<br />
xy <br />
z a bx cy<br />
1<br />
2 a uy x ux y b<br />
y uy y<br />
{s} [D]{ e} [D]{ e}<br />
E(T)<br />
(1 v)(12v)<br />
[5]<br />
[6]<br />
[7]<br />
[8]<br />
[9]
A. Thermal Strain<br />
Thermal strains arise due to volume changes caused by<br />
both temperature differences and phase transformations,<br />
including solidification and solid-state phase changes between<br />
crystal structures, such as austenite and ferrite. The isotropic<br />
thermal-strain vector, {th}, given in Eq. [10], is based on<br />
the phase fractions and the thermal linear-expansion function,<br />
(TLE), discussed in Section X–C.<br />
tt tt t T<br />
5 th 6 (TLE(T ) TLE (T ))51 1 0 16<br />
[10]<br />
B. Inelastic Strain<br />
Inelastic strain includes both strain-rate-independent plasticity<br />
and time-dependent creep. Creep is significant at the<br />
high temperatures <strong>of</strong> this process and is indistinguishable<br />
from plastic strain. Thus, this work adopts a unified constitutive<br />
model <strong>of</strong> the mechanical behavior to capture the temperature-<br />
and strain-rate sensitivity <strong>of</strong> high-temperature steel.<br />
The inelastic strain rate ( is described by different constitutive<br />
models according to the microstructural state <strong>of</strong> the<br />
solid steel.<br />
# in)<br />
[11]<br />
where and are the equivalent inelastic strain rates<br />
<strong>of</strong> ferrite and austenite, respectively, as given in Section X–D.<br />
The scalar inelastic strain-rate function follows the ferrite<br />
function ( or ), whenever the phase fraction <strong>of</strong> ferrite<br />
exceeds 10 pct <strong>of</strong> the total volume. This is justified by considering<br />
the steel with two phases to act as a composite material<br />
in which only a small amount <strong>of</strong> the weaker ferrite phase<br />
weakens the mechanical strength <strong>of</strong> the whole material. The<br />
plain-carbon steels treated in this work are assumed to harden<br />
isotropically, so the von Mises loading surface, associated<br />
plasticity, and normality hypothesis in the Prandtl–Reuss flow<br />
law is applied: [45]<br />
ing<br />
in d<br />
ind<br />
ind pct d 10 pct<br />
ing pct d 10 pct<br />
# in<br />
[12]<br />
where , , and are the plastic strain-rate tensor,<br />
the deviatoric-stress tensor, the equivalent stress scalar (or von<br />
Mises effective stress), and equivalent inelastic strain-rate<br />
scalar, respectively. In this work, the equivalent inelastic<br />
strain rate, , bears a sign determined by the direction <strong>of</strong><br />
the maximum principal inelastic strain, as defined in Eq. [13],<br />
in order to achieve kinematic behavior (Bauschinger effect)<br />
during reverse loading.<br />
<br />
in<br />
s¿ s<br />
in<br />
2<br />
in c<br />
A 3<br />
<br />
in<br />
: in<br />
where c µ<br />
3<br />
<br />
in 2 in s¿<br />
<br />
s<br />
max |max| min<br />
| min|<br />
max min<br />
max min<br />
[13]<br />
where max max( in11, in22, in33) min min( in11, in22, in33)<br />
The “:” operator indicates standard term-by-term tensor<br />
multiplication. Equations [12] and [13] allow an isotropic<br />
scalar to represent the 3-D strain-rate state. Appendix B<br />
defines , and Eq. [12] in 2-D generalized plane-strain<br />
form. Parameter c (1 or 1) makes the equivalent inelastic<br />
strain rate have the same sign as the maximum principal<br />
inelastic strain. The functions for the inelastic strain-rate<br />
scalars, , described in Section X–D, must be integrated<br />
to find the {in} value needed in Eq. [8], as described previously<br />
in this section.<br />
s s<br />
<br />
in<br />
¿<br />
C. Strain in Liquid Elements<br />
In this model, the liquid elements are generally given no<br />
special treatment regarding material properties and finiteelement<br />
assembly. However, liquid reacts very differently<br />
from solid under external loads. It deforms elastically under<br />
hydrostatic force like a solid, but deforms dramatically under<br />
shear force. If any liquid is present in a given finite element,<br />
a constitutive equation is used to generate an extremely rapid<br />
creep (shear) rate:<br />
flow e cA1|c| yield2<br />
0 |c| yield<br />
|c| yield<br />
1154—VOLUME 35B, DECEMBER 2004 METALLURGICAL AND MATERIALS TRANSACTIONS B<br />
[14]<br />
The parameter A is chosen to be 1.5 108 MPa1s1 to<br />
match the viscosity <strong>of</strong> molten steel. [46] Equation [14] is<br />
another format <strong>of</strong> the linear viscous equation [43] <strong>of</strong> the laminar<br />
fluid, which is a reasonable assumption for the liquid<br />
steel in the mushy zone. Liquid deforms under any nonzero<br />
shear stress according to Newtonian fluid dynamics. Thus,<br />
yield should be zero. To avoid numerical difficulty, however,<br />
yield is treated as a tolerance-accuracy parameter with no<br />
physical nature and is given a value <strong>of</strong> 0.01 MPa.<br />
This method effectively increases shear strain and, thus,<br />
enforces negligible liquid strength and shear stress. The critical<br />
temperature where the liquid fraction is sufficient to<br />
make the element act as a liquid is the “coherency temperature”<br />
(Tcoherency), currently defined as being equal to the<br />
solidus temperature. To generalize this scalar strain rate to<br />
a multidimensional strain vector, the same Prandtl–Reuss<br />
Eqs. [12] and [13] are used as for the solid, .<br />
This fixed-grid approach avoids the difficulties <strong>of</strong> adaptive<br />
meshing while allowing strain to accumulate in the<br />
mushy region. As in the real continuous casting process, the<br />
total mass <strong>of</strong> the liquid domain is not constant. The inelastic<br />
strain accumulated in the liquid represents mass transport<br />
due to fluid flow and, so, is denoted “flow strain.” Positive<br />
flow strain indicates fluid feeding into the region. This is<br />
important for the prediction <strong>of</strong> hot-tear cracks. The disadvantage<br />
<strong>of</strong> using this high-creep-rate function to model liquid<br />
is the increased computational difficulty at the solidification<br />
front. This requires the use <strong>of</strong> a very robust local iteration<br />
algorithm. [3]<br />
in<br />
V. FINITE-ELEMENT IMPLEMENTATION<br />
A. Heat-Transfer and Solidification Model<br />
The three-node triangle finite element was employed to<br />
approximate temperature in the domain as a piecewise linear<br />
function. The standard Galerkin method [44] applied to<br />
Eq. [2] gives the following global matrix equations:<br />
[K ]{T} [C]{T}<br />
{Fq} {Fqsup} [15]
where [K] is the conductance matrix including the effect <strong>of</strong><br />
conductivity (k(T)), and [C] is the capacitance matrix including<br />
the effect <strong>of</strong> specific heat and latent heat in H(T). Within<br />
each element, an effective specific heat (c pe) is evaluated using<br />
a spatial averaging technique suggested by Lemmon. [47]<br />
c pe H<br />
T <br />
[16]<br />
The [K] and [C] matrices are found from their element matrices,<br />
given in Appendix A, through standard finite-element method<br />
summation over the domain. A three-level time-stepping method<br />
proposed by Dupont et al. [48] was adopted to solve Eq. [15].<br />
Temperatures at the current time t t are found from the temperatures<br />
at the previous two time steps, t and t t.<br />
{T} 1<br />
4 53T tt T tt 6<br />
[17]<br />
{T [18]<br />
Substituting Eqs. [17] and [18] into Eq. [15] and rearranging<br />
gives a recursive global matrix equation expressing the time and<br />
spatial discretization <strong>of</strong> the heat-conduction equation (Eq. [2]).<br />
} e T tt T t<br />
f<br />
t<br />
1<br />
4 [K] 5T tt 6 [C]<br />
t {T t c<br />
}<br />
3 [C]<br />
[K] <br />
4 t d {Ttt } {Fq} {Fqsup} [19]<br />
Equation [19] is solved at each time step for the unknown<br />
nodal temperatures {T tt } using a Choleski decomposition<br />
solver. [49] The terms {F q} and {F qsup} are the heat-flow-load<br />
vectors containing the distributed heat flux at the domain<br />
boundary and the superheat flux at the internal moving boundary,<br />
respectively. On each domain boundary where heat flux<br />
is applied, the contributions from each element on the boundary<br />
are summed as follows:<br />
{Fq} a ∫[N]<br />
boundary elements<br />
qij Lij T q dL<br />
<br />
a<br />
a<br />
boundary elements<br />
µ<br />
a H<br />
x b<br />
2<br />
a H<br />
y b<br />
2<br />
a T<br />
x b<br />
2<br />
a T<br />
y b<br />
2<br />
2<br />
qij Lij 2<br />
[20]<br />
where L ij is the distance between node i and j. The heat-flux<br />
function (q) is specified, such as being equal to the q gap value<br />
given in Section VII. The term {F qsup} is calculated similarly<br />
with a different set <strong>of</strong> boundary elements, using q sup<br />
in Section VII.<br />
B. Stress Model<br />
Applying the standard Galerkin method to Eqs. [4] through<br />
[7] gives the following set <strong>of</strong> linear equations over the finiteelement<br />
domain:<br />
[K]{u} tt {F th} tt {F in} tt<br />
∂<br />
5F fp6 tt {F el} t<br />
[21]<br />
where [K], {Fth}, {Fin}, {Ffp}, and {Fel} are the stiffness<br />
matrix and incremental force vectors due to incremental thermal<br />
strain, inelastic strain, ferrostatic pressure and external<br />
surface tractions at specified boundaries, and elastic-strain<br />
corrections from the previous time step, respectively. Refer<br />
to Eqs. [64] through [67] in Appendix B for more details. At<br />
each time step, Eq. [21] is solved for the incremental displacements<br />
({u}) using the Choleski method, [49] and the<br />
total displacements are updated via Eq. [22].<br />
{u} [22]<br />
Then, the total strains and stresses are updated from Eqs. [5]<br />
and [6], respectively. The six-node quadratic-displacement triangle<br />
elements use the same grid <strong>of</strong> nodes that were connected<br />
into three-node elements for the heat-flow calculation. Further<br />
details are given in Appendix B.<br />
tt {u} t {u}<br />
VI. INTEGRATION OF THE CONSTITUTIVE<br />
MODEL<br />
Highly strain-rate-dependent inelastic models require a<br />
robust numerical integration technique to avoid numerical<br />
difficulties. The nonlinear equations to be integrated are<br />
given in Eqs. [23] and [24] by combining Eqs. [6] through<br />
[8], neglecting the second term on the right-hand side <strong>of</strong><br />
Eq. [6].<br />
tt tt t<br />
s D : 1 th<br />
<br />
t <br />
<br />
in<br />
t tt<br />
<br />
<br />
<br />
<br />
th<br />
tt <br />
<br />
in<br />
tt2 METALLURGICAL AND MATERIALS TRANSACTIONS B VOLUME 35B, DECEMBER 2004—1155<br />
[23]<br />
tt t tt<br />
in in in [24]<br />
The incremental equivalent plastic strain accumulated over<br />
a time step is given in Eq. [25] based on a highly nonlinear<br />
constitutive function, which depends on s and in, which<br />
change greatly over the time step.<br />
tt tt tt<br />
in F(T, s , in , pct C)t [25]<br />
where F is one <strong>of</strong> the constitutive functions given in Eqs. [46],<br />
[47], or [14], depending on the current material state. Substituting<br />
Eqs. [12] and [25] into Eqs. [23] and [24] and using a<br />
fully implicit time-stepping method, a new set <strong>of</strong> evolution<br />
equations are obtained as follows:<br />
tt tt t<br />
s D : a th<br />
<br />
t in<br />
t ˆ th tt t<br />
3<br />
2 F(T, stt , tt<br />
in , pct C ) s tt<br />
¿<br />
<br />
s<br />
tt tb<br />
[26]<br />
[27]<br />
Two tensors, and , and one scalar, , comprise<br />
13 unknown scalar fields for 3-D problems or nine<br />
unknowns for the 2-D problem here, which require the solution<br />
<strong>of</strong> Eqs. [26] and [27]. Zhu implemented an alternating<br />
implicit-explicit mixed time-integration scheme, which is<br />
based on an operator-splitting technique that alternates<br />
between local and global forms <strong>of</strong> the total strain increment<br />
and inelastic strain rate over each pair <strong>of</strong> successive<br />
steps. [3] tt t tt tt<br />
in in F(T, s , in , pct C)t<br />
tt<br />
tt<br />
s ˆ<br />
<br />
<br />
<br />
in<br />
tt tt<br />
Within each time step, s and in are first solved
using a fully implicit time-integration technique based on<br />
the current best estimation <strong>of</strong> the total strain increment ,<br />
which is taken from the previous time step . This is a<br />
“local step” because it is spatially uncoupled.<br />
Then, the improved estimates <strong>of</strong> and from the<br />
local step are used to solve for by explicit finite-element<br />
spatial integration through Eqs. [21] and [5]. This is a “global<br />
step.” [3]<br />
There is still a tensor unknown in Eq. [26], which makes<br />
even the local time-integration step computationally challenging.<br />
Lush et al. transformed this tensor equation into<br />
a scalar equation for isotropic materials with isotropic<br />
hardening. [50]<br />
ˆ<br />
t<br />
<br />
<br />
<br />
tt tt<br />
s <br />
<br />
in<br />
<br />
<br />
s [28]<br />
tt<br />
where s* is the equivalent stress <strong>of</strong> the stress tensor,<br />
s* tt<br />
, defined subsequently.<br />
tt s * tt 3m tt F(T, s tt tt<br />
, in , pct C)t<br />
s* tt tt t<br />
D : ( <br />
<br />
th<br />
t <br />
<br />
in<br />
t ˆ <br />
th<br />
tt t<br />
[29]<br />
Equations [27] and [28] form a pair <strong>of</strong> nonlinear scalar<br />
equations to solve in the local step for estimates <strong>of</strong> the two<br />
unknowns and s .<br />
tt<br />
in tt<br />
Stress-Model Numerical Integration Procedure<br />
Implementing the general 3-D procedure described previously<br />
for the 2-D generalized plane-strain assumption, the<br />
integration procedure used in CON2D within each time step<br />
is summarized as follows.<br />
(1) Estimate based on {u} from the previous time<br />
step: .<br />
(2) Calculate , and , needed to define<br />
the direction <strong>of</strong> the stress vector.<br />
[30]<br />
(3) Solve the following two ordinary differential equations<br />
simultaneously for and at each local Gauss<br />
point, using a fully implicit bounded Newton–Raphson<br />
integration method from Lush et al. [50] This method gives<br />
the best robustness and efficiency <strong>of</strong> several alternative<br />
approaches evaluated. [3] Function F is either the<br />
Kozlowski model III for (Eq. [46]), the power law for<br />
(Eq. [47]), or the flow strain for liquid phase (Eq. [14]).<br />
[31]<br />
sˆ<br />
(4) Expand this scalar stress estimate into vector form:*<br />
tt s * tt 3m tt F (T, sˆ tt sˆ tt t tt tt<br />
in in F (T, sˆ , in , pct C)t<br />
tt , in , pct C)t<br />
tt<br />
<br />
tt<br />
in # th<br />
tt t{1 1 0 1} T {s*}<br />
2<br />
tt [D] tt1{} t {th} t {in} t {s*¿}<br />
{} ˆ<br />
tt<br />
{s*} tt {ˆ} [B]{u}<br />
, s*<br />
t<br />
{ˆ}<br />
{s*¿} tt {s*} tt 1<br />
3 s* m tt {d} T ; sm * tt s x * tt s y * tt<br />
s* z tt ; {d} {1 1 0 1}<br />
tt {s*¿} tt<br />
[32]<br />
tt<br />
(5) Calculate from sˆ and in using the appropriate<br />
F values for the local material phase.<br />
tt<br />
<br />
{sˆ }<br />
tt<br />
in tt 1<br />
sˆ tt<br />
s* 3 sm *tt {d} T<br />
(6) Expand this scalar inelastic-strain estimate into a vector<br />
with the same direction as using<br />
the Prandtl–Reuss Eq. [12]; update<br />
only for solidified elements.<br />
(7) Use classic finite-element method spatial integration<br />
(Appendix B) to solve Eq. [21] for {u} tt based on<br />
{ .<br />
# in} tt<br />
{ # in} tt {in} t<br />
tt {in} t {sˆ ¿}<br />
<br />
tt<br />
{ # in} tt<br />
(8) Finally, find {} tt from {u} tt t t<br />
and update {}<br />
and {} tt .<br />
Overall, this alternating implicit-explicit scheme with<br />
the bounded Newton–Raphson iteration gives the best robustness<br />
and efficiency <strong>of</strong> several alternative finite-element<br />
method time-integration approaches evaluated. [3]<br />
VII. TREATMENT OF THE MOLD/SHELL<br />
INTERFACE<br />
Heat transfer does not depend directly on the forceequilibrium<br />
equation, because the mechanical dissipation<br />
energy is negligible. The heat-flow and stress models are<br />
fully coupled with each other, however, when the gap<br />
between the mold and steel shell is taken into account.<br />
Shrinkage <strong>of</strong> the shell tends to increase the thermal resistance<br />
across the gap where the shell is strong enough to<br />
pull away from the mold wall. This leads to hot and weak<br />
spots on the shell. This interdependence <strong>of</strong> the gap size and<br />
the thermal resistance requires iteration between the heata<br />
priori and stress models. As the gap size is unknown<br />
advance, the heat resistance is also unknown. Thus, iterations<br />
within a time step are usually needed. Contact between<br />
the mold wall and shell surface is discussed in Section VIII–B.<br />
A. Interface Heat Transfer<br />
When the coupled heat-transfer and thermal-stress analysis<br />
is performed, the heat-transfer boundary condition at the steel<br />
surface is described by a gap heat-resistor model shown in<br />
Figure 2, with parameter values listed in Table I. Heat leaves<br />
Fig. 2—Schematic <strong>of</strong> thermal resistor model <strong>of</strong> the interfacial layer between<br />
mold and billet<br />
Table I. Parameters <strong>of</strong> the Interface Model<br />
Cooling water heat-transfer coefficient,<br />
h water (W/m 2 K) 22,000 to 25,000<br />
Cooling water temperature, T water (°C) 30 to 42<br />
Mold wall thickness, d mold (mm) 6<br />
Mold wall conductivity, k mold (W/m K) 360<br />
Gap conductivity, k gap (W/m K) 0.02<br />
Contact resistance, r contact (m 2 K/W) 6 10 4<br />
Mold wall emissitivity 0.5<br />
Steel emissitivity 0.8<br />
1156—VOLUME 35B, DECEMBER 2004 METALLURGICAL AND MATERIALS TRANSACTIONS B
the steel shell via conduction and radiation across the interfacial<br />
gap. It is then conducted across the thin copper mold<br />
and extracted by cooling water flowing across the back <strong>of</strong> the<br />
mold tube. The temperature and the heat-convection coefficient<br />
<strong>of</strong> the cooling water are input from the results <strong>of</strong> a preliminary<br />
computation using the CON1D model, described elsewhere. [51]<br />
The contact resistance adopted in this model is several orders<br />
<strong>of</strong> magnitude larger than the physical contact resistance [46]<br />
between a flat steel and copper surface, because it includes the<br />
influence <strong>of</strong> oscillation marks. [51] The gap thickness is calculated<br />
during each iteration from the shell-surface displacement<br />
and the mold wall position, according to the local values <strong>of</strong><br />
the mold taper and distortion, which are described in the next<br />
section. Once the gap size is determined, the heat flux (q gap)<br />
across the interfacial layer between the mold wall and steel surface<br />
is solved together with the mold hot-face temperature (T mold):<br />
where<br />
[33]<br />
B. Gap-Size Calculation<br />
The gap thickness (dgap) is estimated for each boundary<br />
node at the shell surface, based on gaps from the previous<br />
iteration (n):<br />
where<br />
e <br />
1<br />
m<br />
Tmold 5.67 108 4<br />
e Tshell Tshell>r mold Twater>r gap<br />
1>r mold 1>r gap<br />
r mold d mold h water k mold<br />
h water k mold<br />
1<br />
rgap dgap rcontact kgap q gap T shellT water<br />
r gapmold<br />
rgapmold 1<br />
<br />
hwater Tmold <br />
kmold h rad 5.67 10 8 e(T shell T mold)(T shell<br />
1<br />
1<br />
s dˆ n1 n tt<br />
gap max1{u(dgap)}<br />
nˆ dwall , dgapmin2<br />
tt tt tt<br />
dwall dtaper dmolddist<br />
d gap<br />
k gap<br />
[34]<br />
where {u}, ˆn, d wall, d taper, d molddist, and d gapmin are the displacement<br />
vector at boundary nodes, unit-normal vector to the<br />
mold wall surface, mold wall position, mold wall position<br />
change due to mold distortion, and the minimum gap thickness,<br />
respectively. A positive d gap value indicates a real space<br />
between the mold and shell.<br />
The minimum gap value is set as<br />
d gapmin r contact k gap<br />
r contact<br />
1 hrad a dgap rcontactb kgap 2 2<br />
Tmold<br />
)<br />
[35]<br />
It physically represents the effective oscillation-mark depth<br />
at the shell surface. When the calculated gap size is less than<br />
this minimum gap size, then the contact resistance (r contact)<br />
dominates heat transfer between the shell surface and the<br />
mold wall. Gap-size variation within the minimum gap size<br />
is assumed not to affect the thermal resistance, which accelerates<br />
convergence.<br />
C. Thermal-Stress Coupling<br />
The overall flow <strong>of</strong> CON2D is shown in Figure 3. Within<br />
each time step, the computation alternates between the heattransfer<br />
and stress models through the following fully coupled<br />
procedure<br />
(1) The temperature field is solved based on the current<br />
best estimation <strong>of</strong> gap size, from the previous time step,<br />
with Eq. [34]. The initial gap size at the beginning <strong>of</strong><br />
the simulation is simply zero around the strand perimeter<br />
as the liquid steel at the meniscus flows to match the<br />
mold contour.<br />
(2) The incremental thermal strain is evaluated from the<br />
temperature field at the current and previous time steps<br />
(Eq. [10]). The inelastic strain is estimated by integrating<br />
Eq. [31] following the procedure described in Section<br />
VI. The global matrix equation, Eq. [21], is solved<br />
for displacements, strains, and stresses using the standard<br />
finite-element method.<br />
(3) The gap sizes for the next iteration are updated by<br />
n1<br />
dgap b dˆ n1 n<br />
gap (1 b)dgap<br />
METALLURGICAL AND MATERIALS TRANSACTIONS B VOLUME 35B, DECEMBER 2004—1157<br />
[36]<br />
where is chosen to be 0.5.<br />
(4) Finally, steps 1 through 3 are repeated until the gap-size<br />
difference between two successive heat-transfer and<br />
stress iterations, n and n 1, is small enough:<br />
d diff <br />
a<br />
a nb<br />
n1 n 2<br />
1dgap dgap2<br />
[37]<br />
where nb is the number <strong>of</strong> boundary nodes. When d diff<br />
becomes smaller than the specified “gap tolerance” (d min),<br />
the gap size is considered converged.<br />
VIII. MODELING THE MOLD WALL<br />
The mold wall affects the calculation in two ways: (1)<br />
altering the size <strong>of</strong> the interfacial gap and associated heat<br />
transfer between the mold and strand through its distorted<br />
shape; and (2) constraining the shell from bulging due to<br />
the internal ferrostatic pressure.<br />
A. Mold Wall Shape<br />
The mold wall is defined in CON2D as a function <strong>of</strong><br />
distance below the meniscus. The shape <strong>of</strong> the mold varies<br />
from its dimensions at the meniscus due to mold taper and<br />
mold distortion. The mold is tapered to follow the shrinkage<br />
<strong>of</strong> the steel strand to prevent excessive gaps from forming<br />
between the mold wall and shell surface, as well as<br />
a nb<br />
n1 2<br />
1dgap 2
Fig. 3—Flow chart <strong>of</strong> CON2D.<br />
preventing bulging <strong>of</strong> the shell. Linear taper is defined by<br />
providing the percentage per meter as follows:<br />
pct Taper / m<br />
dtaper [38]<br />
100<br />
where W, vc, and t are the mold width, casting speed, and current<br />
time below the meniscus, respectively. As the modeled<br />
section <strong>of</strong> the steel strand moves down from the meniscus,<br />
the mold wall distorts away from the solidifying shell and<br />
tapers toward it.<br />
Mold distortion arises from two main sources: thermal<br />
expansion <strong>of</strong> the mold wall due to heating during operation,<br />
and mold wear due to friction between the mold and the<br />
strand. For the billet-casting simulation presented here, mold<br />
distortion is considered to be simple thermal expansion as<br />
follows, ignoring residual distortion and mold wear.<br />
W<br />
2 vc t<br />
W<br />
dmolddist amold 2 1TT02 [39]<br />
where T<br />
is the average temperature through the mold wall<br />
thickness as a function <strong>of</strong> the distance below the mold exit,<br />
is the average mold wall temperature where the solid shell<br />
begins at the meniscus, mold is the thermal-expansion coefficient<br />
<strong>of</strong> the copper mold tube, and W is the section width.<br />
Arbitrary complex mold shapes can be modeled by providing<br />
an external data file or function with mold wall positions<br />
at different distances below the meniscus and even around<br />
the perimeter. For example, complex 3-D mold distortion pr<strong>of</strong>iles<br />
[52] were used for slab casting simulations with CON2D. [2,6]<br />
T0 B. Contact Algorithm for Shell-Surface Constraint<br />
The mold wall provides support to the solidifying shell before<br />
it reaches the mold exit. A proper mold wall constraint is needed<br />
to prevent the solidifying shell from penetrating the mold wall,<br />
while also allowing the shell to shrink freely. Because the exact<br />
contact area between the mold wall and the solidifying shell is<br />
not known a priori, an iterative solution procedure is needed.<br />
1158—VOLUME 35B, DECEMBER 2004 METALLURGICAL AND MATERIALS TRANSACTIONS B
Some early finite-element models solved contact problems<br />
by the Lagrange multiplier approach, which introduces<br />
new unknowns to the system as well as numerical difficulties.<br />
[53] This work adopts a method developed and implemented<br />
by Moitra, [2,6] which is tailored to this particular<br />
casting-problem domain. It solves the contact problem only<br />
approximately, but is easy to implement and is more stable.<br />
Iteration within a time step proceeds as follows.<br />
At first, the shell is allowed to deform freely without mold<br />
constraint. Then, the intermediate shell surface is compared<br />
to the current mold wall position. A fraction <strong>of</strong> all penetrating<br />
nodes, identified by Eq. [40], is restrained back to the<br />
mold wall position by a standard penalty method, and the<br />
stress simulation is repeated.<br />
{u} [40]<br />
where dpen is the specified penetration tolerance. Iteration<br />
continues until no penetration occurs.<br />
The nodes to be constrained are chosen by checking three<br />
scenarios.<br />
(1) In Figure 4(a), a portion <strong>of</strong> the shell surface with length<br />
L penetrates the mold, and the maximum penetration is<br />
# nˆ dwall dpen (a)<br />
(b)<br />
(c)<br />
Fig. 4—(a) through (c) Three types <strong>of</strong> penetration modes in contact<br />
algorithm.<br />
found at the centerline <strong>of</strong> the strand face. Those shell<br />
boundary nodes in the half <strong>of</strong> this violated length nearest<br />
to the face center (L c) are constrained in the next<br />
iteration.<br />
(2) In Figure 4(b), the center <strong>of</strong> the shell surface penetrates<br />
the mold but does not penetrate the most. Those<br />
violated nodes from the maximum penetration position<br />
to the face center are constrained in the next iteration.<br />
(3) In Figure 4(c), the center <strong>of</strong> the shell surface does not<br />
penetrate the mold. That half <strong>of</strong> the violated nodes closest<br />
to the face center is constrained in the next iteration.<br />
Commercial s<strong>of</strong>tware, such as ABAQUS, generally constrains<br />
violated nodes one by one until convergence is<br />
reached. The present method is believed to be more computationally<br />
efficient for the particular quarter mold and<br />
behavior <strong>of</strong> interest in this work. The friction between the<br />
shell and mold surface is ignored in this model. This would<br />
need to be added to consider phenomena such as transverse<br />
cracks due to excessive taper.<br />
IX. SOLIDIFICATION FRONT TREATMENT<br />
A. Superheat Flux<br />
Superheat is the amount <strong>of</strong> heat stored in the liquid steel<br />
that needs to be extracted before it reaches the liquidus temperature.<br />
Superheat is treated in one <strong>of</strong> two ways: (1) the heatconduction<br />
method and (2) the superheat-flux method. The<br />
heat-conduction method simply sets the initial steel temperature<br />
to the pouring temperature and increases the conductivity<br />
<strong>of</strong> the liquid by 6.5 times to crudely approximate the effects<br />
<strong>of</strong> fluid flow. This method equally distributes the superheat<br />
over the solidification front. In reality, the superheat distribution<br />
is uneven due to the flow pattern in the liquid pool.<br />
The second method first obtains the superheat-flux distribution<br />
from a separate fluid-flow computation, such as<br />
done previously for billets [54] or slabs. [55] This superheat flux<br />
at a given location on the strand perimeter is applied to<br />
appropriate nodes on the solidification front. Specifically,<br />
it is applied to the two nodes just below the liquidus in those<br />
3-node elements with exactly one node above the liquidus.<br />
This is shown in Figure 5, where the isotherm is the liquidus.<br />
The initial liquid temperature is set just above the liquidus,<br />
to avoid accounting for the superheat twice.<br />
Fig. 5—Schematic <strong>of</strong> how ferrostatic pressure is applied at the internal<br />
boundary.<br />
METALLURGICAL AND MATERIALS TRANSACTIONS B VOLUME 35B, DECEMBER 2004—1159
B. Ferrostatic Pressure<br />
Ferrostatic pressure greatly affects gap formation by encouraging<br />
contact between the shell and mold, depending on the<br />
shell strength. The ferrostatic pressure is calculated by<br />
Fp rgz<br />
[41]<br />
where z is the distance <strong>of</strong> the current slice from the meniscus,<br />
found from the casting speed and the current time. Ferrostatic<br />
pressure is treated as an internal load that pushes the<br />
shell toward the mold wall, as shown in Figure 5. It is applied<br />
equally to those two nodes just below the coherency temperature<br />
that belong to those three-node elements having exactly<br />
one <strong>of</strong> its three nodes above the Tcoherency isotherm. It is<br />
assembled to the global force vector through Eq. [64] in<br />
Appendix B, which gives<br />
{F fp} a<br />
moving boundary elements µ<br />
F p L ij<br />
2 ∂<br />
Fp Lij [42]<br />
where L ij is the boundary length between nodes i and j within<br />
a three-node element.<br />
X. MATERIAL PROPERTIES<br />
This work adopts temperature-dependent steel properties<br />
chosen to be as realistic as possible.<br />
A. Phase-Fraction Model<br />
A pseudobinary-phase diagram for certain plain-carbon<br />
steels,* developed from measurements by WON, [56] is incor-<br />
*Other elements besides iron and carbon are 1.52 wt pct Mn, 0.015 wt<br />
pct S, 0.012 wt pct P, and 0.34 wt pct Si.<br />
porated to produce realistic phase-fraction evolution between<br />
the solidus and liquidus temperatures. Figure 6 shows the<br />
nonequilibrium Fe-C phase diagram, which defines the volume<br />
fractions <strong>of</strong> liquid, -ferrite, and austenite used in this<br />
work. The classical lever rule is used to calculate phase fractions<br />
in each two-phase region, and a lever rule for ternary<br />
systems is used in the three-phase region. [57] The 100 and<br />
Fig. 6—Non-equilibrium Fe-C phase diagram [38] used in CON2D.<br />
2<br />
75 pct solid lines are compared with zero strength temperature<br />
(ZST) and zero ductility temperature (ZDT) measurements<br />
by Schmidtmann et al. [38] They match very well.<br />
Figure 7 shows the phase fractions thus generated as a<br />
function <strong>of</strong> temperature for the 0.04 pct C carbon steel, which<br />
is used in Section XIII. Note that the liquid fraction decreases<br />
parabolically as the steel cools from its liquidus. This agrees<br />
with a more sophisticated microsegregation model. [38]<br />
B. Thermal Properties<br />
The temperature-dependent conductivity function for plaincarbon<br />
steel is fitted from measured data compiled by<br />
Harste [58] and is given in Eq. [43]. Figure 8 shows the conductivity<br />
for several typical plain-carbon steels. The conductivity<br />
increases linearly through the mushy zone to the liquid<br />
by a factor <strong>of</strong> 6.5 to partly account for the effect <strong>of</strong> convection<br />
due to flow in the liquid steel pool. [55]<br />
(1 a1(pct C) a Ka (80.91 9.9269 10<br />
2 )<br />
2<br />
T(°C) 4.613 10 5<br />
T(°C) 2 )<br />
1160—VOLUME 35B, DECEMBER 2004 METALLURGICAL AND MATERIALS TRANSACTIONS B<br />
where<br />
K(W/mK) K a f a K g f g K d f d K l f l<br />
Fig. 7—Fraction as a function <strong>of</strong> temperature for the 0.04%C steel.<br />
Fig. 8—Conductivity <strong>of</strong> plain carbon steels.
K g 21.6 8.35 10 3 T(°C)<br />
K d (20.14 9.313 10 3 T(°C))(1 a 1(pct C) a 2 )<br />
K l 39.0<br />
a1 0.425 4.385 10 4<br />
T(°C)<br />
a 2 0.209 1.09 10 3 T(°C)<br />
[43]<br />
The enthalpy curve used to relate heat content and temperature<br />
in this work, H(T), is obtained by integrating the<br />
specific heat curve fitted from measured data complied by<br />
Harste [58] as given in Eq. [44]. Figure 9 shows the enthalpy<br />
for typical plain-carbon steels.<br />
where<br />
H <br />
H(kJ/Kg) H a f a H g f g H d f d H l f l<br />
5188 T(K) 1 86 0.505T(K)<br />
6.55 10<br />
T(K) 800<br />
5 T(K) 2 1.5 107 T(K) 3<br />
1.11 106 T(K) 1 4.72 T(K)<br />
2.292 10<br />
800 T(K) 1000<br />
3 T(K) 2 4056<br />
11.5 T(K) 6.238 103 T(K) 2<br />
5780<br />
1000 T(K) 1042<br />
34.87 T(K) 0.016013 T(K) 2<br />
18,379<br />
1042 T(K) 1060<br />
10.068 T(K) 2.9934 103 T(K) 2<br />
5.21766 10<br />
1060 T(K) 1184<br />
6 T(K) 1 h<br />
12,822<br />
H g 0.43T (K) 7.5 10 5 T(K) 2 93 a g<br />
where a g [37(pct C) 1.9 103 (pct C) 2 ]<br />
(44(pct C) 1200)<br />
H d 0.441T (K) 8.87 10 5 T(K) 2 51 a d<br />
where a d [18(pct C) 2.0 103 (pct C) 2 ]<br />
(44(pct C) 1200)<br />
H [44]<br />
l 0.825T (K) 105<br />
For the multiphase region, both conductivity and enthalpy are<br />
calculated by weighted averaging <strong>of</strong> their different phase frac-<br />
Fig. 9—Enthalpy <strong>of</strong> plain carbon steels.<br />
tions ( f ). The subscripts (, , , and l) in Eqs. [43] and [44]<br />
represent -ferrite, austenite, -ferrite, and liquid, respectively.<br />
Density is assumed constant (7400 Kg/m 3 ) in order to maintain<br />
constant mass.<br />
C. Thermal Linear Expansion<br />
The thermal linear-expansion function is obtained from<br />
solid-phase density measurements complied by Harste [58]<br />
and Harste et al. [59] and liquid density measurements by<br />
Jimbo and Cramb. [60]<br />
100(8011 0.47T(°C))<br />
rd <br />
(100 (pct C))(1 0.013(pct C))<br />
rl 7100 73(pct C) (0.8 0.09(pct C))<br />
(T(°C) 1550)<br />
3<br />
100(8106 0.51T(°C))<br />
rg <br />
(100 (pct C))(1 0.008(pct C)) 3<br />
ra 7881 0.324T(°C) 3 10 5 T(°C) 2<br />
r(Kg/m 3 ) ra fa rg fg rd fd rl fl METALLURGICAL AND MATERIALS TRANSACTIONS B VOLUME 35B, DECEMBER 2004—1161<br />
where<br />
3<br />
TLE <br />
B<br />
r(T0) 1<br />
r(T)<br />
[45]<br />
A simple mixture rule is applied to obtain the overall density<br />
from the values <strong>of</strong> the different phases. Figure 10 shows the<br />
thermal linear-expansion curves for typical plain-carbon<br />
steels, assuming the arbitrary reference temperature, T 0, to<br />
be the solidus temperature.<br />
D. Inelastic Constitutive Properties<br />
The unified constitutive model developed here uses the<br />
instantaneous equivalent inelastic strain rate, , as the scalarstate<br />
function, which depends on the current equivalent stress,<br />
temperature, steel carbon content, and the current equivalent<br />
inelastic strain, which accumulates below the solidus temperature.<br />
[61,62,63] The model was developed to match tensile-test<br />
measurements <strong>of</strong> Wray [62] and creep-test data <strong>of</strong> Suzuki et al. [64]<br />
in<br />
Fig. 10—Thermal linear expansion (TLE) <strong>of</strong> plain carbon steels.
Model III by Kozlowski, given in Eq. [46], is adopted to simulate<br />
the mechanical behavior <strong>of</strong> austenite.<br />
where<br />
[46]<br />
where the direction <strong>of</strong> (c) is given in Eq. [13], except using<br />
the principal stresses instead <strong>of</strong> principal strain components.<br />
A power-law model was developed to model the behavior<br />
<strong>of</strong> -ferrite, [11] s<br />
given as follows:<br />
where<br />
ing(1/s) fpctC|Fg| f 4.465 104<br />
31<br />
Fg exp a b<br />
T(K)<br />
F g cs (MPa) f 1 in | in| f 21<br />
f 1 130.5 5.128 10 3 T(K)<br />
f 2 0.6289 1.114 10 3 T(K)<br />
f 3 8.132 1.54 10 3 T(K)<br />
f pctC 4.655 10 4 7.14 10 4 (pct C)<br />
1.2 10 5 (pct C) 2<br />
ind(1/s) 0.1F d |F d| n1<br />
cs (MPa)<br />
Fd <br />
fc(T(K)/300) 5.5211 1000|in|2 m<br />
f C 1.3678 10 4 (pct C) 5.56102<br />
m 9.4156 10 5 T(K) 0.349501<br />
n (1.617 10 4 T(K) 0.06166) 1<br />
[47]<br />
Figure 11 compares the stresses measured by Wray [62] to<br />
those predicted by the constitutive models at 5 pct strain,<br />
integrated under different constant strain rates. The constitutive<br />
models give acceptable performance. This figure also shows<br />
that -ferrite, which forms at higher temperatures found near<br />
the solidification front, is much weaker than austenite. This<br />
greatly affects the mechanical behavior <strong>of</strong> the solidifying<br />
steel shell.<br />
Fig. 11—Comparison <strong>of</strong> CON2D predicted and measured stress [62] at 5 pct<br />
plastic strain.<br />
A simple mixture rule is not appropriate in two-phase<br />
regions that contain interconnecting regions <strong>of</strong> a much weaker<br />
phase. Thus, the constitutive model given in Eq. [47] is applied<br />
in the solid whenever the volume fraction <strong>of</strong> ferrite (-ferrite<br />
above 1400 °C, -ferrite below 900 °C) is more than 10 pct.<br />
Otherwise, Eq. [46] is adopted.<br />
To make the constitutive model properly handle kinematic<br />
hardening during reverse loading, the equivalent stress/strain<br />
used in Eqs. [46] and [47] is given the same sign as the principal<br />
stress/strain having the maximum magnitude. The inelastic<br />
strain rate, as a consequence, also bears a sign.<br />
Two uniaxial tensile experiments [42,63] and a creep experiment<br />
[64] on plain-carbon steel at elevated temperatures were<br />
simulated by CON2D to test the performance <strong>of</strong> its constitutive<br />
models. Figures 12(a) and (b) show CON2D predictions<br />
<strong>of</strong> tensile-test behavior <strong>of</strong> austenite and delta-ferrite at constant<br />
strain rate around 10 4 s 1 , which is typically encountered<br />
in the shell during continuous casting. [63] The results also compare<br />
reasonably with experiments at small strain (5 pct),<br />
although they overpredict the stress when the strain exceeds<br />
5 pct. Because the strain generally stays within 5 pct for the<br />
entire continuous casting process, the constitutive models<br />
are quite reasonable for this purpose. Figure 13(a) shows the<br />
CON2D predictions <strong>of</strong> creep-test behavior at constant load.<br />
The inelastic-strain predictions match the measurements rea-<br />
1162—VOLUME 35B, DECEMBER 2004 METALLURGICAL AND MATERIALS TRANSACTIONS B<br />
(a)<br />
(b)<br />
Fig. 12—CON2D predictions compared with tensile-test measurements: [42,62]<br />
(a) Koslowski III law for austenite [61] against tensile test measurements [62]<br />
and (b) Power law for -ferrite [3] against tensile test measurements. [62]
(a)<br />
Fig. 13—Predicted behavior <strong>of</strong> austenite compared with creep and cyclic loading test measurements at 1300 °C: [64] (a) constant load and (b) alternating load.<br />
Fig. 14—Elastic modulus for plain carbon steels used in CON2D. [65]<br />
sonably well, especially at times shorter than 50 seconds, <strong>of</strong><br />
most concern to continuous casting in the mold region. Beyond<br />
this time, CON2D underpredicts creep, which is consistent<br />
with the overprediction <strong>of</strong> stress, observed in the tensile test<br />
cases. Monotonic loading is unlikely beyond this length <strong>of</strong><br />
time, anyway. Figure 13(b) compares CON2D predictions and<br />
creep-test measurements [64] under a sinusoidal alternating load<br />
with full reversal (R ratio 1.167). Although more measurements<br />
and computations <strong>of</strong> complex loading conditions would<br />
be helpful, these comparisons show that the constitutive models<br />
in CON2D are reasonable, even for conditions that include<br />
reverse loading.<br />
E. Elastic Properties<br />
The temperature-dependent elastic-modulus curve used in<br />
this model is a stepwise linear fit <strong>of</strong> measurements by<br />
Mizukami et al., [65] given in Figure 14. Unlike in some other<br />
models, the elastic modulus <strong>of</strong> the liquid here was given the<br />
physically realistic value <strong>of</strong> 10 GPa. The Poisson ratio is<br />
constant at 0.3. Measurements <strong>of</strong> higher Poisson ratios at<br />
high temperature are attributed to creep occurring during the<br />
experiment. Incorrectly incorporating part <strong>of</strong> the volumeconserved<br />
plastic behavior, where 0.5, into the elastic<br />
v would cause numerical difficulty for the solver.<br />
METALLURGICAL AND MATERIALS TRANSACTIONS B VOLUME 35B, DECEMBER 2004—1163<br />
(b)<br />
XI. NUMERICAL PERFORMANCE<br />
A 2-D transient elastic-viscoplastic thermal-stress simulation<br />
with solidification, internal pressure, and contact is a<br />
challenging problem even for a supercomputer. The efficient<br />
algorithms in CON2D allow the complete solution <strong>of</strong> practical<br />
problems in reasonable times with reasonable accuracy.<br />
Coupling between the thermal and stress models can cause<br />
instability, however, unless parameters such as time-step<br />
size, tolerances <strong>of</strong> gap size, and penetration are carefully<br />
chosen. Current experience indicates that the initial time step<br />
for a fully coupled simulation with mold wall constraint<br />
should be 0.0001 seconds, which is 10 times smaller than<br />
the smallest time step size adopted for the uncoupled thermal-stress<br />
simulation by Zhu. [3] The time-step size can be<br />
increased twentyfold up to 0.005 seconds as the simulation<br />
progresses. Increasing the time-step size further does not<br />
speed up the simulation due to the need for more in-step<br />
iterations. It takes about 72 hours to perform a complete,<br />
fully coupled 19-second mold simulation <strong>of</strong> a 120 120<br />
mm billet with 7381 nodes on a PENTIUM* IV 1.7 GHz<br />
*PENTIUM is a trademark <strong>of</strong> the Intel Corporation, Santa Clara, CA.<br />
workstation running the WINDOWS* 2000 Pr<strong>of</strong>essional oper-<br />
*WINDOWS is a trademark <strong>of</strong> the Micros<strong>of</strong>t Corporation, Redmond, CA.<br />
ating system using less than 500 MB <strong>of</strong> random-access memory.<br />
The corresponding simulation without coupling allows<br />
larger time steps (0.001 to 0.5 seconds) and takes only about<br />
5 hours. Below-mold simulations allow even larger steps and<br />
take only about 1 hour. [66]<br />
Reasonable tolerances should be specified to achieve satisfactory<br />
gap-size convergence while avoiding excessive mold<br />
wall penetration. The minimum gap, d gapmin, is chosen here to<br />
be 0.012 mm, which is less than the effective thickness <strong>of</strong> the<br />
oscillation marks and surface roughness. Gaps smaller than this<br />
are considered to be converged. Thus, the effective oscillation<br />
mark-depth dominates the heat resistance across the gap and<br />
must be determined either by measurement or calibration. The<br />
tolerance for the mold wall penetration, d pen, is chosen to be<br />
0.001 mm, which is on the order <strong>of</strong> the incremental displacement<br />
between two consecutive time steps. Too large a tolerance tends
to make the simulation inaccurate, while too small a tolerance<br />
makes the program overreact to small penetrations and slows<br />
down the simulation. The best value <strong>of</strong> d pen depends on the<br />
problem. Generally, a smaller value is needed when the simulation<br />
region <strong>of</strong> interest is closer to the meniscus.<br />
XII. MODEL VALIDATION<br />
An analytical solution <strong>of</strong> the thermal-stress model in an unconstrained<br />
solidifying plate, derived by Weiner and Boley, [67] is<br />
used here as an ideal validation problem for solidification-stress<br />
models. Constants for this validation problem were chosen here<br />
to approximate the conditions <strong>of</strong> interest in this work and are<br />
listed in Table II.<br />
The material in this problem has elastic–perfect plastic behavior.<br />
The yield stress drops linearly with temperature from 20 MPa<br />
at 1000 °C to 0 MPa at the solidus temperature <strong>of</strong> 1494.35 °C.<br />
For the current elastic-viscoplastic model, this constitutive relation<br />
was transformed into a computationally more challenging<br />
form, the highly nonlinear creep function <strong>of</strong> Eq. [14] with A <br />
1.5 10 8 and yield 0.01 MPa in the liquid. A very narrow<br />
mushy region, 0.1 °C, is used to approximate the single melting<br />
temperature assumed by Boley and Weiner. In addition to<br />
the generalized plane-strain condition in the axial z direction, a<br />
similar condition was imposed in the y direction (parallel to the<br />
surface) by coupling the displacements <strong>of</strong> all nodes along the<br />
top surface <strong>of</strong> the slice domain, as shown in Figure 1(c). The<br />
analytical solutions were computed with MATLAB. [68]<br />
Figures 15 and 16 show the temperature and the stress distributions<br />
across the solidifying shell at different solidification<br />
times using an optimized mesh and time step, similar to that<br />
adopted for the 2-D billet-casting simulation. The mesh was<br />
graduated, increasing in size from 0.3 mm at the left-hand end<br />
to 2.0 mm at right-hand end, and the time-step size increased<br />
from 0.001 seconds at the beginning to 0.1 seconds at the end.<br />
Figures 17 and 18 show the relative average errors, given in<br />
Eq. [48] for the temperature and stress predictions, respectively.<br />
Error T (pct) <br />
Error s (pct) <br />
N<br />
a<br />
1<br />
N<br />
a<br />
1<br />
3 1T i CON2D Ti Analytical 2 2<br />
N |T melt T cold|<br />
3 1s i CON2D si Analytical 2 2<br />
N |s (T melt) s (T cold)|<br />
100<br />
100<br />
[48]<br />
Accuracy <strong>of</strong> the CON2D predictions increases if the mesh<br />
and time step are refined together. A fine uniform mesh <strong>of</strong><br />
0.1 mm, with a small uniform time step <strong>of</strong> 0.001 seconds,<br />
produces relative average errors within 1 pct for temperature<br />
and within 2 pct for stress. However, the computational cost<br />
is also high. Note that the inaccuracy is severe at early times<br />
<strong>of</strong> the simulation, especially for the stress predictions. This is<br />
because the solidified layer initially spans only a few elements.<br />
As the solid portion <strong>of</strong> the plate grows thicker, the mesh<br />
size and time-step requirements become less critical. Thus, a<br />
nonuniform mesh with increasing time-step size is better to<br />
satisfy both accuracy and efficiency. The optimal choice,<br />
used in Figures 15 and 16, gives a decent prediction with<br />
the relative average errors within 2 pct for temperature and<br />
3 pct for stress. A similar mesh was adopted for the actual<br />
Table II. Constants Used in Boley and Weiner<br />
Analytical Solution<br />
Conductivity (W/m K) 33.0<br />
Specific heat (kJ/kg K) 0.661<br />
Latent heat (kJ/kg) 272.0<br />
Elastic modulus in solid (GPa) 40.0<br />
Elastic modulus in liquid (GPa) 14.0<br />
Thermal linear expansion coefficient (1/K) 0.00002<br />
Density (kg/m 3 ) 7500.0<br />
Poisson’s ratio 0.3<br />
Melting temperature, T melt (°C) 1494.4<br />
Liquidus temperature (°C) 1494.45<br />
Solidus temperature (°C) 1494.35<br />
Cold surface temperature, T cold (°C) 1000.0<br />
Fig. 15—Temperatures through an infinite solidifying plate at different<br />
solidification times compared with Boley & Weiner analytical solution.<br />
Fig. 16—Stresses through an infinite solidifying plate at different solidification<br />
times compared with Boley & Weiner analytical solution.<br />
billet-casting simulation. This demonstrates that the model<br />
is numerically consistent and has an acceptable mesh.<br />
XIII. APPLICATION TO BILLET CASTING<br />
The CON2D model was next applied to simulate a plant<br />
trial conducted at POSCO (Pohang works, South Korea [18] )<br />
for a 120-mm-square section billet <strong>of</strong> 0.04 pct C steel cast<br />
at 2.2 m/min, where measurements were available. The mold<br />
1164—VOLUME 35B, DECEMBER 2004 METALLURGICAL AND MATERIALS TRANSACTIONS B
(a) (b)<br />
Fig. 17—Temperature error between CON2D and analytical solution [67] from convergence studies: (a) time-step size effect and (b) mesh size effect.<br />
Fig. 18—Stress error between CON2D and analytical solution [67] from convergence<br />
studies: (a) time-step size effect and (b) mesh size effect.<br />
(a)<br />
(b)<br />
had a single linear taper <strong>of</strong> 0.785 pct/m. Details <strong>of</strong> the material<br />
and operation conditions are given in Tables III and IV,<br />
respectively. Two simulations were performed to predict the<br />
temperature, stress, and deformation evolutions <strong>of</strong> the billet<br />
Table III. Material Details in Billet Plant Trial<br />
Steel composition (wt pct) 0.04C<br />
Liquidus temperature (°C) 1532.1<br />
70 pct solid temperature (°C) 1525.2<br />
90 pct solid temperature (°C) 1518.9<br />
Solidus temperature (°C) 1510.9<br />
Austenite : -ferrite starting temperature (°C) 781.36<br />
Eutectoid temperature (°C) 711.22<br />
Table IV. Simulation Conditions in Billet Plant Trial<br />
Billet section size (mm mm) 120 120<br />
Working mold length (mm) 700<br />
Total mold length (mm) 800<br />
<strong>Casting</strong> speed (m/min) 2.2<br />
Mold corner radius, (mm) 4<br />
Taper (pct m)<br />
Time to turn on ferrostatic<br />
0.785 (on each face)<br />
pressure (s) 2.5<br />
Mesh size (mm mm)<br />
Number <strong>of</strong> nodes<br />
0.1 0.1 to 1.4 1.0<br />
(varies with section size)<br />
Number <strong>of</strong> elements<br />
7381<br />
(varies with section size) 7200<br />
Time step size (s) 0.0001 to 0.005<br />
Pouring temperature (°C) 1555.0<br />
Coherency temperature (°C) 1510.9<br />
Gap tolerance, d min<br />
Minimum gap, d gapmin (mm) 0.012<br />
Penetration tolerance, d pen (mm) 0.001<br />
0.001 (0.1 pct)<br />
shell using the 2-D L-shaped domain (Figure 1(b)) and a<br />
slice domain through the centerline <strong>of</strong> the billet face (Figure<br />
1(c)), similar to the Boley and Weiner analytical problem.<br />
The interfacial heat-transfer constants for both simulations<br />
are given in Table I and were found with the help <strong>of</strong> a dedicated<br />
heat-transfer code, CON1D. [51]<br />
The superheat-flux pr<strong>of</strong>ile was obtained from coupled computations<br />
<strong>of</strong> turbulent flow and heat transfer in a round billet<br />
caster by Khodadadi et al. [54] for the case <strong>of</strong> a Grash<strong>of</strong><br />
number (Gr gW 3 (TLE(T pour) TLE(T m))/v 2 ) <strong>of</strong> 1 10 8 .<br />
This value is the closest case to the current problem conditions,<br />
METALLURGICAL AND MATERIALS TRANSACTIONS B VOLUME 35B, DECEMBER 2004—1165
where the Grash<strong>of</strong> number is 2 10 7 , and confirms that<br />
natural convection is unimportant in this process. The heat<br />
flux was calculated from the Nusselt number (Nu) and mean<br />
liquid temperature (T m) results, given as a function <strong>of</strong> distance<br />
below the meniscus, [54] using their values <strong>of</strong> liquid steel conductivity,<br />
k 29.8 W/mK, mold section size, W 200 mm,<br />
and 33 °C superheat, except for readjusting the superheat temperature<br />
difference as follows:<br />
q sup Nu k(T m T liq)<br />
W<br />
( T pour T liq) Posco<br />
(T pour T liq) Khodadadi<br />
Fig. 19—Super heat flux used in CON2D for billet casting simulation.<br />
[49]<br />
where T pour and T liq are the pouring and liquidus temperatures,<br />
respectively. The resulting superheat-flux pr<strong>of</strong>ile is shown in<br />
Figure 19. Note that the total heat integrated from Figure 19<br />
over the mold surface, 48.6 kW, matches the superheat for<br />
the current problem, (T pour T liq)c p c 46 kW.<br />
The heat-flux and mold wall temperatures predicted by<br />
CON2D along the billet-face center are shown in Figures 20<br />
and 21, respectively. These results slightly underpredict the<br />
measurements <strong>of</strong> thermocouples embedded in the mold wall,<br />
which should lie almost exactly between the hot- and coldface<br />
temperatures. [69] The total heat extracted by the mold<br />
Fig. 20—Predicted instantaneous heat flux pr<strong>of</strong>iles in billet casting mold.<br />
(128.5 kW) is 17 pct lower than the plant measurements, based<br />
on a heat balance <strong>of</strong> the mold cooling water (8 K temperature<br />
rise at a 9.2 m/s slot velocity) <strong>of</strong> 154 kW. [18] This is consistent<br />
with underprediction <strong>of</strong> the mold temperatures.<br />
The predicted shell growth for this CON2D simulation<br />
is given in Figure 22, as indicated by the evolution <strong>of</strong> the<br />
solidus and liquidus isotherms. This is compared with measurements<br />
<strong>of</strong> the solid/liquid interface location, obtained<br />
by suddenly adding FeS tracer into the liquid pool during<br />
steady-state casting. [18] Longitudinal and transverse sections<br />
through the billet were cut from the final product. The transverse<br />
section was 285 mm from the meniscus when the FeS<br />
tracer was added. Because FeS tracer cannot penetrate the<br />
solid steel shell, sulfur prints <strong>of</strong> sections cut through the<br />
fully solidified billet reveal the location <strong>of</strong> the solidification<br />
front and shell-thickness pr<strong>of</strong>ile at a typical instant during<br />
the process. [18] The CON2D predictions match along the<br />
centerline beyond the first 80 mm below the meniscus, where<br />
the shell remains in contact with the mold, suggesting that<br />
the heat-transfer parameters are reasonably accurate.<br />
The shell-surface-position pr<strong>of</strong>ile down the centerline is<br />
shown in Figure 23, together with the mold wall position, which<br />
includes both the taper and the mold-distortion pr<strong>of</strong>ile calcu-<br />
Fig. 21—Predicted mold wall temperature pr<strong>of</strong>iles compared with plant<br />
measurements.<br />
Fig. 22—Predicted shell thickness pr<strong>of</strong>iles for billet casting compared with<br />
plant measurements.<br />
1166—VOLUME 35B, DECEMBER 2004 METALLURGICAL AND MATERIALS TRANSACTIONS B
Fig. 23—Mold distortion, mold wall position, and shell surface pr<strong>of</strong>iles for<br />
the billet casting simulation.<br />
Fig. 24—Gap evolution predicted by CON2D for the billet casting<br />
simulation.<br />
lated from the CON1D temperature results using Eq. [39]. [51]<br />
The shell surface generally follows the mold wall with no obvious<br />
penetration, validating the contact algorithm. Note, however,<br />
that a slight gap opens up within the first 25 mm. Although<br />
this effect is believed to be physically reasonable owing to rapid<br />
initial shrinkage <strong>of</strong> the steel, it is exaggerated here, owing to<br />
numerical difficulties during the initial stages <strong>of</strong> solidification.<br />
This causes an overprediction <strong>of</strong> the drop in initial heat flux<br />
and temperature observed in Figure 20. This drop is followed<br />
by increased heat flux (and corresponding mold wall temperature)<br />
after full contact is re-established, which has also been<br />
observed in other measurements. [70]<br />
The simulation features a detailed prediction <strong>of</strong> temperature,<br />
shrinkage, and stress in the region <strong>of</strong> the rounded billet corner.<br />
The evolution <strong>of</strong> the increases in gap size and surface<br />
temperature are given in Figures 24 and 25 near (20 mm) to<br />
the centerline <strong>of</strong> the billet face and at various locations 0, 5,<br />
10, and 15 mm from the billet corner. The corresponding<br />
large drops in heat flux are included in Figure 20. The solidifying<br />
shell quickly becomes strong enough to pull the billet<br />
corner away from the mold wall and form a gap around the<br />
corner region. The gap greatly decreases local heat flow in<br />
the corner, causing the mold wall temperature to drop.<br />
The drop in mold temperature near the corner over the<br />
initial 80 mm is more than expected in reality, because the<br />
Fig. 25—Shell surface temperatures predicted for billet casting simulation.<br />
Fig. 26—Temperature contours at 285 mm below meniscus compared with<br />
corresponding sulfur print from plant trial.<br />
simple mold model <strong>of</strong> CON2D in Eq. [33] neglects heat conduction<br />
around the corner and along the casting direction.<br />
Thus, these predictions are not presented. This latter<br />
effect, which is included in CON1D, [51] also contributed to<br />
the convergence difficulties along the centerline discussed<br />
in Figure 23. Fortunately, it has little other effect on heat<br />
flux or shell behavior.<br />
Figure 24 shows how a permanent gap forms after 40 mm<br />
below the meniscus, which grows to over 0.3-mm thick by<br />
halfway down the mold, growing little after that. Corresponding<br />
gaps form adjacent to the corner at later times, reaching smaller<br />
maxima partway down the mold. These gaps form because the<br />
simple linear taper <strong>of</strong> the mold walls was insufficient to match<br />
shrinkage <strong>of</strong> the shell. The corner effect decreases with distance<br />
from the corner and disappears beyond 15 mm from the corner.<br />
The corner gap and drop in heat flux cause a hot spot at the<br />
corner region, as shown in the surface-temperature pr<strong>of</strong>iles <strong>of</strong><br />
Figure 25. The CON2D model predicts that the shell corner<br />
reheats slightly and becomes 150 °C hotter than billet-face<br />
center, for the conditions <strong>of</strong> this trial. The decreased heat flux<br />
also produces less solidification in the corner, as illustrated in<br />
Figure 26 at 285 mm below the meniscus. The predicted shell<br />
METALLURGICAL AND MATERIALS TRANSACTIONS B VOLUME 35B, DECEMBER 2004—1167
thinning around the corner is consistent with the plant measurements<br />
from the sulfur print, as quantified in Figures 22 and 26.<br />
The predictions here are also consistent with those <strong>of</strong> Park et<br />
al., who modeled how increasing the billet-mold corner radius<br />
leads to more severe hot and thin spots near the corner. [18] This<br />
tends to validate the CON2D model and the simple constant<br />
interfacial heat-transfer parameters used to produce these results.<br />
Improving the accuracy would likely require a more complex<br />
model <strong>of</strong> gap heat transfer that considered details <strong>of</strong> surface<br />
roughness, including differences between the center and corner.<br />
Figure 27 shows the evolution <strong>of</strong> surface-stress components<br />
near the centerline <strong>of</strong> the billet face. Stress normal to the<br />
surface (x direction) is effectively equal to zero, which indicates<br />
that the 0.785 pct/m mold taper never squeezes the billet. The<br />
stress components perpendicular to the solidification direction<br />
(y direction tangential to the surface and z casting direction)<br />
are generally very similar, which matches the behavior<br />
expected from the analytical test solution. [67] These stresses<br />
grow slowly in tension during the period <strong>of</strong> increasing heatextraction<br />
rate from 20 to 100 mm below the meniscus. They<br />
reach a maximum <strong>of</strong> almost 3 MPa due to the increase in<br />
shell strength at lower temperature that accompanies the transformation<br />
from -ferrite to austenite. This is shown in the<br />
through-thickness pr<strong>of</strong>ile <strong>of</strong> these same stress components in<br />
Figure 28(a), but is calculated with the 1-D slice domain. The<br />
surface tensile-stress peak does not penetrate very deep, owing<br />
to the very thin layer <strong>of</strong> material colder than 10 pct deltaferrite.<br />
Thus, this peak might cause very shallow fine surface<br />
cracks, but nothing deeper.<br />
The surface stresses in Figure 27 suddenly turn compressive<br />
beyond 100 mm due to the sudden change in heat-extraction<br />
rate at this distance (Figure 20). Surface compression arises<br />
because the subsurface begins to cool and shrink faster than<br />
the surface. This causes a corresponding increase in subsurface<br />
tension near the solidification front that might lead to subsurface<br />
cracks. The surface stays in compression from 4 to 6 MPa<br />
for the remaining time in the mold.<br />
During the time beyond 100 mm, the stress pr<strong>of</strong>ile (Figure<br />
28(b)) is qualitatively similar to that <strong>of</strong> the analytical<br />
test problem, as expected. Differences arise from the variation<br />
in steel strength between the -ferrite and austenite.<br />
Stresses in the liquid, mushy zone, and -ferrite are always very<br />
small. Tensile stress increases rapidly during the phase transfor-<br />
Fig. 27—Surface stress histories predicted near the billet face center (2-D<br />
L-mesh domain).<br />
mation, which takes place at the low end <strong>of</strong> the region<br />
<strong>of</strong> Figure 28. When the -ferrite region is thin, this tensile<br />
stress is more likely to create strains significant to generate<br />
cracks. These results illustrate the widely accepted knowledge<br />
that surface cracks initiate near the meniscus, while<br />
subsurface cracks form lower down.<br />
Figures 29(a) and (b) show the different components <strong>of</strong><br />
strain (y direction) through the shell thickness near the billetface<br />
center corresponding to the stresses in Figure 28. Thermal<br />
strains dominate in the solid and generate the other<br />
strains due to the constraint <strong>of</strong> adjacent layers <strong>of</strong> steel. Small<br />
elastic strains are generated by the mismatch <strong>of</strong> thermal<br />
strain, although the stresses they generate may still be significant.<br />
Inelastic strain is generated in regions <strong>of</strong> high stress,<br />
starting in the region. It is high at the surface at the<br />
top <strong>of</strong> the mold and later grows in the austenite. Note that<br />
inelastic strains are all tensile throughout the shell. The <br />
and mushy zones behave elastically with very low stresses.<br />
This is fortunate, as these phases are very weak and cannot<br />
accommodate much inelastic strain before cracking. Flow<br />
strain in the liquid occurs to accommodate the total strain,<br />
which is naturally flat, owing to the constraint by the solid.<br />
Figure 30 shows the “hoop” stress component (y direction<br />
parallel to the billet surface and perpendicular to the<br />
Fig. 28—Stress and temperature predicted through the shell thickness far<br />
from billet corner (slice domain): (a) 100 mm below meniscus and (b) mold<br />
exit (700 mm below meniscus.<br />
1168—VOLUME 35B, DECEMBER 2004 METALLURGICAL AND MATERIALS TRANSACTIONS B<br />
(a)<br />
(b)
(a)<br />
(b)<br />
Fig. 29—Strain components predicted through the shell thickness far away<br />
from billet corner (slice domain): (a) 100 mm below meniscus and (b) mold<br />
exit (700 mm below meniscus).<br />
Fig. 30—Stress predicted through the shell thickness near billet corner (2-<br />
D L-mesh domain).<br />
casting direction) at an <strong>of</strong>f-corner location (10 mm above<br />
the billet corner) through the shell thickness at 100, 500, and<br />
700 mm (mold exit) below the meniscus. Stresses all behave<br />
similarly to the corresponding locations along the billet centerline,<br />
except that the tension and compression are lower. This is<br />
Fig. 31—Stress contours predicted at mold exit.<br />
Fig. 32—Inelastic strain contours predicted at mold exit.<br />
expected due to the slower cooling rates, shallower temperature<br />
gradients, and higher temperatures near the corner.<br />
Figures 31 and 32 show contours <strong>of</strong> the stress and inelastic<br />
strain components perpendicular to the solidification direction<br />
superimposed on the distorted billet at the mold exit with<br />
isotherms. The insufficient 0.785 pct/m taper <strong>of</strong> this mold is<br />
unable to support the billet, which allows a slight bulge (0.25 mm<br />
at the mold exit). Regions <strong>of</strong> high tensile stress and inelastic<br />
strain are indicated at the <strong>of</strong>f-corner subsurface (10 to 20 mm<br />
from the corner and 2 to 6 mm beneath the surface).<br />
XIV. CONCLUSIONS<br />
A transient, two-dimensional, finite-element model has been<br />
developed to quantify the temperature, stress, and strain distributions<br />
in the solidifying shell in the continuous casting <strong>of</strong><br />
steel. This is a Lagrangian approach in generalized plane strain<br />
that reasonably predicts the 3-D stress and strain state by solving<br />
energy- and force-balance equations within a 2-D transverse<br />
slice domain. Superheat dissipation and ferrostatic pressure are<br />
both taken account <strong>of</strong> through internal boundary conditions.<br />
Unified elastic-viscoplastic constitutive models for both the<br />
austenite and -ferrite phases <strong>of</strong> the steel match tensile- and<br />
creep-test data. Liquid is given physically reasonable properties,<br />
including a high viscoplastic shear rate and small yield<br />
METALLURGICAL AND MATERIALS TRANSACTIONS B VOLUME 35B, DECEMBER 2004—1169
stress. A robust and efficient time-integration technique, the<br />
alternating local-global method, is adopted to integrate the<br />
highly nonlinear constitutive equations. An efficient contact<br />
algorithm allows the model to properly treat shell-surface interaction<br />
with the mold wall.<br />
The model is validated by extensive comparisons with an<br />
analytical solution <strong>of</strong> thermal stress in an infinite solidifying<br />
plate, which justify the choice <strong>of</strong> mesh and time-step<br />
size. The model is applied to simulate a 120-mm-square billet<br />
continuously cast at 2.2 m/min, and the results compare<br />
favorably to in-plant measurements <strong>of</strong> thermocouples embedded<br />
in the mold walls, heat balance on the cooling water,<br />
and thickness <strong>of</strong> the solidified shell.<br />
The CON2D model is a useful tool to gain quantitative<br />
understanding <strong>of</strong> issues pertaining to the thermal-mechanical<br />
behavior <strong>of</strong> the solidifying shell during the continuous casting<br />
<strong>of</strong> steel slabs and billets. It is being applied to investigate<br />
taper in billets [71] and slabs, [72] minimum shell thickness to<br />
avoid breakouts, [30] maximum casting speed to avoid longitudinal<br />
cracks due to <strong>of</strong>f-corner bulging below the mold, [66] and<br />
other phenomena. [75]<br />
ACKNOWLEDGMENTS<br />
The authors thank the steel industry members <strong>of</strong> the <strong>Continuous</strong><br />
<strong>Casting</strong> <strong>Consortium</strong> at UIUC for their financial support<br />
<strong>of</strong> this project. Work by previous students, A. Moitra, H. Zhu,<br />
and J. Parkman, on the CON2D program is also gratefully<br />
acknowledged. The authors also thank the National Center<br />
for Supercomputing Applications (NCSA) for computational<br />
resources.<br />
APPENDIX A<br />
Finite-element implementation <strong>of</strong> heat-transfer model<br />
A. Linear Temperature Triangles<br />
The small triangles in Figure [A1] show the constant temperature-gradient<br />
triangle element used for the heat-flow<br />
model. Temperature within an element is interpolated by the<br />
same shape functions used to interpolate the coordinates.<br />
[A1]<br />
The [B] matrix in global coordinate system can be obtained as<br />
[B] [A2]<br />
where A is the area <strong>of</strong> the triangle element.<br />
1<br />
2A c y 3<br />
T a Ni (x, y)Ti i1<br />
2 y3 y3 y1 y1 y2 d<br />
x3 x2 x1 x3 x2 x1 B. Conductance Matrix and Capacitance Matrix<br />
The element conductance and capacitance matrices needed<br />
to assemble Eq. [15] are given in Eqs. [A3] and [A4]. [73]<br />
[K ] el ∫[B] T<br />
c ke 0<br />
[C] el ∫[N] T rcpe [N]dA rcpeA 12 £<br />
2 1 1<br />
1 2 1§<br />
1 1 2<br />
0<br />
k e<br />
d [B]dA<br />
[A3]<br />
[A4]<br />
Fig. A1—Six-node quadratic displacement triangle element with Gauss<br />
points for stress model and corresponding 4 three-node linear temperature<br />
triangle elements.<br />
where k e is the average conductivity <strong>of</strong> the three nodal values<br />
within each element and c pe is the effective specific heat<br />
within the element, given by Eq. [16].<br />
APPENDIX B<br />
Finite-element implementation <strong>of</strong> stress model<br />
A. Linear Strain Elements<br />
Figure [A1] shows the six-node linear-strain isoparametric<br />
triangle finite element used in this work. Global coordinates<br />
and displacements within each element are interpolated<br />
from its nodal values by<br />
1170—VOLUME 35B, DECEMBER 2004 METALLURGICAL AND MATERIALS TRANSACTIONS B<br />
[B1]<br />
[B2]<br />
where the shape functions in natural local coordinates are<br />
[Ni1,2,p,6] [s(2s 1) t(2t 1) r(2r 1) 4st 4tr 4sr]<br />
r 1 s t<br />
[B3]<br />
B. Generalized Plane Strain Formulation<br />
The three unknowns, a, b, and c, which describe the out<strong>of</strong>-plane<br />
strain in Eq. [5], are assembled into the finite-element<br />
equations to be solved concurrently within the in-plane displacements.<br />
The displacement vector is therefore<br />
where<br />
e x<br />
y f 6<br />
a<br />
i1<br />
e u<br />
v f 6<br />
a<br />
i1<br />
e d f •e u<br />
151 121 f<br />
T<br />
c Ni 0 xi de f<br />
0 N yi<br />
i<br />
c Ni 0 ui d<br />
0 N e<br />
i v f<br />
i<br />
a b c <br />
e u<br />
121 f e u T<br />
1 p u6 v1 p v6 f<br />
T<br />
[B4]
The strain-displacement relationship is<br />
[B5]<br />
The [B] for matrix generalized plane strain is given as<br />
where<br />
c B<br />
312 d F<br />
µ<br />
The elastic stress-strain relation is<br />
sx sy s xy<br />
s z<br />
The deviatoric stress vector is<br />
5s6¿ e s x 1<br />
3 s m s y 1<br />
3 s m s z 1<br />
3 s m t xy f<br />
where<br />
5 x y xy z6T c B¿ d 5d6<br />
415<br />
c B d c 0 d<br />
312 33<br />
c B¿ d ≥<br />
415<br />
c 0<br />
112 d<br />
¥<br />
1 x y<br />
N 1<br />
x p N 6<br />
x 0 p 0<br />
0 p 0<br />
N1 y p N6 y<br />
∂ [D] ±µ<br />
The von-Mises or “equivalent” stress is<br />
1<br />
s <br />
A 2 1 (sxsy) 2 (sxsz) 2 (szsy) 2 2<br />
2txy2 [B6]<br />
[B8]<br />
[B9]<br />
C. Global Stiffness Matrix and Force Vectors<br />
The global stiffness matrix [K], and force vectors, {Fth },<br />
{Fpl }, {Ffp}, and {Fel}, in Eq. [21] are assembled from<br />
the local stiffness matrix and force vectors <strong>of</strong> each element<br />
at the current time step t t.<br />
n<br />
[K] a ∫ 1[B] e2 Ae<br />
e1<br />
T [D][B] e dA<br />
nb<br />
{F fp} a<br />
e1<br />
n<br />
{Fth} a ∫ 1[B] e2 Ae<br />
e1<br />
T [D]{ th }dA<br />
n<br />
{Fin} a<br />
e1<br />
x y xy<br />
z<br />
s m s x s y s z<br />
∫ Lfp<br />
∂ µ<br />
N 1<br />
T<br />
T<br />
0<br />
T<br />
1[N] e2 T (F p)dL fp<br />
∫ Ae 1[B] e2 T [D]{ in }dA<br />
n<br />
{Fel} a ∫ 1[B] e2 Ae e1<br />
T [D]{ el }dA<br />
y p N6 y<br />
N1 x p N V<br />
6<br />
x<br />
plx ply ∂ µ ∂≤<br />
plxy plz [B7]<br />
[B10]<br />
[B11]<br />
[B12]<br />
[B13]<br />
[B14]<br />
Integrals are evaluated numerically using standard secondorder<br />
Gauss quadrature [74] according to the integration sampling<br />
points given in Figure 33 with a constant weighting<br />
factor <strong>of</strong> 1/3.<br />
NOMENCLATURE<br />
cp specific heat <strong>of</strong> steel (kJ/kg K)<br />
c sign <strong>of</strong> the equivalent stress/strain<br />
E Young’s modulus (MPa)<br />
Fp ferrostatic pressure<br />
g gravity acceleration<br />
H enthalpy <strong>of</strong> steel (kJ/kg)<br />
k conductivity <strong>of</strong> steel (W/m K)<br />
Nu Nusselt number<br />
q heat flux<br />
T temperature (°C)<br />
TLE thermal linear expansion<br />
TB brittle temperature range<br />
u displacement (m)<br />
vc casting speed<br />
W mold section size<br />
b body force vector<br />
[C] capacitance matrix<br />
[D], D elasticity matrix/tensor<br />
<br />
{Ffp} force vector due to ferrostatic pressure<br />
{Fq} heat flow load vector<br />
[K] conductance matrix for heat-transfer model;<br />
stiffness matrix for stress model<br />
ˆn unit vector normal to the mold wall surface<br />
{Q} heat generation vector<br />
,<br />
{} strain tensor/vector<br />
<br />
ˆ estimated <strong>of</strong> total strain increment<br />
<br />
s,<br />
{s} stress tensor/vector<br />
<br />
s¿,<br />
{s}¿ deviatoric stress tensor/vector<br />
<br />
s*,<br />
{s}* stress tensor/vector without inelastic increa-<br />
<br />
ment components<br />
thermal expansion coefficient<br />
strain<br />
equivalent strain<br />
lame constant<br />
v Poisson’s ratio<br />
density <strong>of</strong> steel (kg/m 3 )<br />
equivalent stress<br />
yield stress (MPa)<br />
METALLURGICAL AND MATERIALS TRANSACTIONS B VOLUME 35B, DECEMBER 2004—1171<br />
s<br />
yield<br />
Subscripts<br />
flow flow<br />
in inelastic<br />
th thermal<br />
x component along x direction<br />
y component along y direction<br />
austenite<br />
-ferrite<br />
elastic<br />
REFERENCES<br />
1. W.R. Storkman: Masters Thesis, <strong>University</strong> <strong>of</strong> Illinois, at Urbana-<br />
Champaign, Urbana, IL, 1990.<br />
2. A. Moitra: Ph.D. Thesis, Urbana-Champaign, Urbana, IL, 1993, p. 217.<br />
3. H. Zhu: Ph.D. Thesis, Urbana-Champaign, Urbana, IL, 1996, p. 132.
4. J.-C.T. Parkman: Master’s Thesis, UIUC, Urbana, IL, 2000, p. 139.<br />
5. W.R. Storkman and B.G. Thomas: in Modeling <strong>of</strong> <strong>Casting</strong> and Welding<br />
Processes, A.G. Giamei and G.J. Abbaschian, eds., Engineering Foundation,<br />
Palm Coast, FL, 1988, vol. 4, pp. 287-97.<br />
6. A. Moitra, B.G. Thomas, and H. Zhu: in 76th Steelmaking Conf.,<br />
Dallas, TX, 1993, ISS, Warrendale, PA, 1993, vol. 76, p. 657.<br />
7. B.G. Thomas, A. Moitra, and W.R. Storkman: Proc., 6th Int. Iron and Steel<br />
Congr., Iron and Steel Institute Japan, Tokyo, 1990, vol. 3, pp. 348-55.<br />
8. B.G. Thomas and H. Zhu: Proc. Int. Symp. on Advanced Materials and<br />
Technologies for 21st Century, I. Ohnaka and D. Stefanescu, eds., TMS,<br />
Warrendale, PA, 1996, pp. 197-208.<br />
9. G.D. Lawson, S.C. Sander, W.H. Emling, A. Moitra, and B.G. Thomas:<br />
77th Steelmaking Conf., Chicago, IL, 1994, Iron and Steel Society,<br />
Warrendale, PA, 1994, p. 239.<br />
10. B.G. Thomas, A. Moitra, and R. McDavid: ISS Trans., 1996, vol. 23 (4),<br />
pp. 57-70.<br />
11. B.G. Thomas and J.T. Parkman: Thermec ‘97, Int. Conf. on Thermomechanical<br />
Processing <strong>of</strong> Steel and Other Materials, Wollongong,<br />
Australia, 1997, TMS, Warrendale, PA, 1997, vol. II, pp. 2279-85.<br />
12. B.G. Thomas and J.T. Parkman: TMS Annual Meeting, TMS,<br />
Warrendale, PA, San Antonio, TX, 1998, M.C.A.E. Lavernia, ed.<br />
13. A. Grill, J.K. Brimacombe, and F. Weinberg: Ironmaking and Steelmaking,<br />
1976, vol. 3 (1), pp. 38-47.<br />
14. K. Sorimachi and J.K. Brimacombe: Ironmaking and Steelmaking,<br />
1977, vol. 4 (4), pp. 240-45.<br />
15. J.O. Kristiansson: J. Thermal Stresses, 1984, vol. 7, pp. 209-26.<br />
16. J.E. Kelly, K.P. Michalek, T.G. O’Connor, B.G. Thomas, and J.A.<br />
Dantzig: Metall. Trans. A, 1988, vol. 19A, pp. 2589-2602.<br />
17. J.R. Boehmer, G. Funk, M. Jordan, and F.N. Fett: Adv. Eng. S<strong>of</strong>tware,<br />
1998, vol. 29 (7–9), pp. 679-97.<br />
18. J.-k. Park, B.G. Thomas, and I.V. Samarasekera: Ironmaking and Steelmaking,<br />
2002, vol. 29 (5), pp. 359-75.<br />
19. M. Bellet, V.D. Fachinotti, O. Jaouen, S. De La Chapelle, I. Poitrault: in<br />
Modeling <strong>of</strong> <strong>Casting</strong>, Welding and Advanced Solidification Processes-X,<br />
D. Stefanescu, J. Warren, M. Jolly, and M. Krane, eds., TMS, Warrendale,<br />
PA, 2003, pp. 361-68.<br />
20. J.-E. Lee, T.-J. Yeo, K.H. Oh, J.-K. Yoon, and U.-S. Yoon: Metall. Mater.<br />
Trans. A, 2000, vol. 31A, pp. 225-37.<br />
21. K. Sorimachi and T. Emi: Tetsu-to-Hagané (J. Iron Steel Inst. Jpn.), 1977,<br />
vol. 63 (8), pp. 1297-1304.<br />
22. A. Grill and K. Schwerdtfeger: Ironmaking and Steelmaking, 1979,<br />
vol. 6 (3), pp. 131-35.<br />
23. K. Kinoshita, T. Emi, and M. Kasai: Tetsu-to-Hagané, 1979, vol. 1979 (14),<br />
p. 2022.<br />
24. F.G. Rammerstorfer, C. Jaquemar, D.F. Fischer, and H. Wiesinger: in<br />
Numerical Methods in Thermal Problems, R.W. Lewis and K. Morgan,<br />
eds., Pineridge Press, Swansea, U.K., 1979, pp. 712-22.<br />
25. J.O. Kristiansson: J. Thermal Stresses, 1982, vol. 5 (3–4), pp. 315-30.<br />
26. I. Ohnaka and Y. Yashima: in Modeling and Control <strong>of</strong> <strong>Casting</strong> and<br />
Welding Processes IV, Palm Coast, FL, 1988, TMS/AIME, Warrendale,<br />
PA, 1988, pp. 385-94.<br />
27. T.C. Tszeng and S. Kobayashi: Int. J. Machine Tools and Manufacture<br />
(Int. J. Machining Tools Manufacturing), 1989, vol. 29 (1), pp. 121-40.<br />
28. H. Zhu: Ph.D. Thesis, <strong>University</strong> <strong>of</strong> Illinois, at Urbana-Champaign,<br />
Urbana, IL, 1997.<br />
29. J. Parkman: Master’s Thesis, <strong>University</strong> <strong>of</strong> Illinois, 2000.<br />
30. C. Li and B.G. Thomas: Brimacombe Memorial Symp., Vancouver,<br />
Canada, Canadian Institute <strong>of</strong> Mining and Metallurgy, Montreal,<br />
Canada, 2000, p. 17.<br />
31. A.E. Huespe, A. Cardona, and V. Fachinotti: Computer Methods Appl.<br />
Mech. Eng., 2000, vol. 182 (3), pp. 439-55.<br />
32. A. Ramacciotti: Steel Res., 1988, vol. 59 (10), pp. 438-48.<br />
33. T.G. O’Conner: Ph.D. Thesis, <strong>University</strong> <strong>of</strong> Illinois, at Urbana-Champaign,<br />
Urbana, IL,1992.<br />
34. J.-K. Park: Ph.D. Thesis, <strong>University</strong> <strong>of</strong> British Columbia, 2002.<br />
35. B.G. Thomas: 74th Steelmaking Conf. Proc., ISS, Warrendale, PA, 1991,<br />
vol. 74, pp. 105-18.<br />
36. B.G. Thomas: in Making, Shaping and Treating <strong>of</strong> Steel: <strong>Continuous</strong><br />
<strong>Casting</strong>, A. Cramb, ed., AISE Steel Foundation, Pittsburgh, PA, 2003,<br />
vol. 5, pp. 5.1-5.24.<br />
37. B.G. Thomas and L. Zhang: Iron Steel Inst. Jpn. Int., 2001, vol. 41 (10),<br />
pp. 1185-97.<br />
38. Y.M. Won and B.G. Thomas: Metall. Mater. Trans. A, 2001, vol. 32A,<br />
pp. 1755-67.<br />
39. B.G. Thomas, G. Li, A. Moitra, and D. Habing: Iron Steelmaker (ISS<br />
Trans.), 1998, vol. 25 (10), pp. 125-43.<br />
40. B.G. Thomas: Metall. Mater. Trans. B, 2002, vol. 33B, pp. 795-812.<br />
41. L. Yu: Master’s Thesis, <strong>University</strong> <strong>of</strong> Illinois, at Urbana-Champaign,<br />
Urbana, IL, 2000.<br />
42. Y. Won, T.-J. Yeo, D. Seol, and K. Oh: Metall. Mater. Trans. B, 2000,<br />
vol. 31B, pp. 779-94.<br />
43. J.A. Dantzig and C.L. Tucker: Modeling in Materials Processing,<br />
Cambridge <strong>University</strong> Press, New York, NY, 2001.<br />
44. O.C. Zienkiewicz and R.L. Taylor: The Finite Element Method, 5th ed.,<br />
Butterworth-Heinemann, Oxford, Boston, MA, 2000, vol. 1, p. 689.<br />
45. J. Lemaitre and J.L. Chaboche: Mechanics <strong>of</strong> Solid Materials, Cambridge<br />
<strong>University</strong> Press, New York, NY, 1990, p. 556.<br />
46. R.C. Weast: Handbook <strong>of</strong> Chemistry and Physics, 1971.<br />
47. E. Lemmon: in Numerical Methods in Heat Transfer, R.W. Lewis,<br />
K. Morgan, and O.C. Zienkiewicz, eds., John Wiley & Sons, New<br />
York, NY, 1981, vol. 1, pp. 201-13.<br />
48. T. Dupont, G. Fairweather, and J.P. Johnson: SIAM J. Numerical<br />
Analysis, 1974, vol. 11 (2), pp. 392-410.<br />
49. G.E. Forsythe and C.B. Moler: Prentice-Hall Series in Automatic Computation,<br />
Prentice-Hall, Englewood Cliffs, NJ, 1967.<br />
50. A.M. Lush, G. Weber, and L. Anand: Int. J. Plasticity, 1989, vol. 5,<br />
pp. 521-49.<br />
51. Y. Meng and B.G. Thomas: Metall. Trans. B, 2003, vol. 34B, pp. 685-705.<br />
52. B.G. Thomas, G. Li, A. Moitra, and D. Habing: 80th Steelmaking Conf.<br />
Proc., ISS, Warrendale, PA, 1997, vol. 80, pp. 183-201.<br />
53. B. Nour-Omid and P. Wriggers: Computer Methods Appl. Mech. Eng.,<br />
1986, vol. 54, pp. 131-44.<br />
54. J.M. Khodadadi, X.K. Lan, and F. Shen: ASME, New York, NY,<br />
American Society, 28th National Heat Transfer Conf. Exhib., San Diego,<br />
CA, 1992, vol. 196, pp. 59-67.<br />
55. X. Huang, B.G. Thomas, and F.M. Najjar: Metall. Trans. B, 1992, vol. 23B,<br />
pp. 339-56.<br />
56. Y.M. Won, K.-h. Kim, T.-j. Yeo, and K.H. Oh: Iron Steel Inst. Jpn. Int.,<br />
1998, vol. 38 (10), pp. 1093-99.<br />
57. M.C. Flemings: Solidification Processing, McGraw-Hill Series in Materials<br />
Science and Engineering, M.B. Bever, M.E. Shank, C.A. Wert,<br />
and R.F. Mehl, eds., McGraw-Hill, New York, NY, 1974, p. 364.<br />
58. K. Harste: Ph.D. Thesis, Technical <strong>University</strong> <strong>of</strong> Clausthal, Clausthal,<br />
1989, p. 115.<br />
59. K. Harste, A. Jablonka, and K. Schwerdtfeger: 4th Int. Conf. <strong>Continuous</strong><br />
<strong>Casting</strong>, Brussels, Belgium, Verlag Stahleisen, Dusseldorf 1988,<br />
vol. 2, pp. 633-44.<br />
60. I. Jimbo and A.A.W. Cramb: Metall. Trans. B, 1993, vol. 24B, pp. 5-10.<br />
61. P. Kozlowski, B.G. Thomas; J. Azzi, and H. Wang: Metall. Trans. A,<br />
1992, vol. 23A, pp. 903-18.<br />
62. P.J. Wray: Metall. Trans. A, 1976, vol. 7A, pp. 1621-27.<br />
63. P.J. Wray: Metall. Trans. A, 1982, vol. 13A, pp. 125-34.<br />
64. T. Suzuki, K.H. Tacke, K. Wunnenberg, and K. Schwerdtfeger: Ironmaking<br />
Steelmaking, 1988, vol. 15 (2), pp. 90-100.<br />
65. H. Mizukami, K. Murakami, and Y. Miyashita: Tetsu-to-Hagané (J. Iron<br />
Steel Inst. Jpn.), 1977, vol. 63 (146), p. S-652.<br />
66. C. Li and B.G. Thomas: in Steelmaking Conf. Proc., ISS, Warrendale,<br />
PA, 2002, vol. 85, pp. 109-30.<br />
67. J.H. Weiner and B.A. Boley: J. Mech. Phys. Solids, 1963, vol. 11,<br />
pp. 145-54.<br />
68. T. Mathworks Inc.: MATLAB User Manual, Natick, MA, 1999, Ver. 5.3.<br />
69. J.K. Park, C. Li, B.G. Thomas, and I.V. Samarasekera: 60th Electric<br />
Furnace Conf., San Antonio, TX, 2002, AIST, Warrendale, PA, 2002,<br />
vol. 60, p. 17.<br />
70. C. Chow: Master’s Thesis, <strong>University</strong> <strong>of</strong> British Columbia, 2001.<br />
71. C. Li and B.G. Thomas: Steelmaking Conf. Proc., ISS, Warrendale,<br />
PA, 2003, vol. 86.<br />
72. C. Ojeda and B.G. Thomas: ISSTech 2003, Indianapolis, IN, 2003,<br />
ISS, Warrendale, PA, 2003.<br />
73. R.D. Cook, D.S. Malkus, and M.E. Plesha: Concepts and Applications<br />
<strong>of</strong> Finite Element Analysis, 3rd ed., John Wiley & Sons, New York,<br />
NY, 1989, p. 630.<br />
74. T.W. Clyne, M. Wolf, and W. Kurz: Metall. Mater. Trans. B, 1982,<br />
vol. 13B, pp. 259-66.<br />
75. Y. Meng, C. Li, J. Parkman, and B.G. Thomas: in Solidification Processes<br />
and Microstructures: A Symposium in Honor <strong>of</strong> Pr<strong>of</strong>. W. Kurz, M. Rappaz,<br />
C. Beckermann, and R. Trivedi, eds., TMS, Warrendale, PA, 2004,<br />
pp. 33-39.<br />
1172—VOLUME 35B, DECEMBER 2004 METALLURGICAL AND MATERIALS TRANSACTIONS B