- Page 1 and 2:
National Women’s Annual Clinical
- Page 3 and 4:
It is my pleasure to present the 20
- Page 5 and 6:
7 LABOUR AND BIRTH OUTCOMES .......
- Page 7 and 8:
Table 50: Neonatal outcomes followi
- Page 9 and 10:
Table 153: Preterm birth and matern
- Page 11 and 12:
Table 258: Perinatal mortality rate
- Page 13 and 14:
Figure 53: Mode of birth (1991-2010
- Page 15:
Chapter 1 INTRODUCTION 1
- Page 18 and 19:
Chapter 8: Postnatal care This chap
- Page 20 and 21: 1.5.3 Gynaecologic data quality As
- Page 23 and 24: 2 SERVICE PROVISION 2.1 Maternity s
- Page 25 and 26: 2.2.4 Antenatal and Postnatal Wards
- Page 27 and 28: The service has access to the ACH L
- Page 29 and 30: 2.5.3 University Links There are cl
- Page 31 and 32: Reportable events All incidents (mi
- Page 33: Chaptern 3 SUMMARY STATISTICS 19
- Page 36 and 37: 3.2 Summary of maternal outcomes 20
- Page 38 and 39: Rate Table 7: Perinatal related mor
- Page 40 and 41: Maternal indicator Caesarean sectio
- Page 42 and 43: 50 45 40 35 30 25 20 15 10 5 0 % Ep
- Page 45 and 46: 4 MATERNAL DEMOGRAPHY This chapter
- Page 47 and 48: 4.2.2 Maternal ethnicity When more
- Page 49 and 50: % 60 50 40 30 20 10 0 NZ European M
- Page 51 and 52: 4.5 Body mass index Thirty five per
- Page 53 and 54: % 100 80 60 40 20 0 European Maori
- Page 55: Women booked with a private obstetr
- Page 59 and 60: 5 ANTENATAL COMPLICATIONS This chap
- Page 61 and 62: Ethnic differences in rates of pret
- Page 63 and 64: of women under 20 with SGA babies s
- Page 65 and 66: Perinatal deaths in term SGA infant
- Page 67 and 68: The rate of multiple pregnancy rema
- Page 69: Summary / Implications Multiple pre
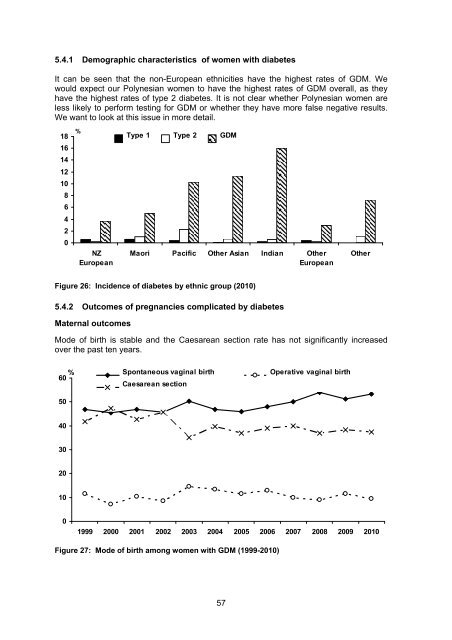
- Page 73 and 74: 5.4.5 Perinatal losses Diabetes Per
- Page 75 and 76: A confirmed placental abruption is
- Page 77 and 78: 70 60 50 40 30 20 10 0 % Gestationa
- Page 79 and 80: 5.7 Body Mass Index Methods BMI is
- Page 81 and 82: % European Maori Pacific Other Asia
- Page 83 and 84: 50 45 40 35 30 25 20 15 10 5 0 % Eu
- Page 85 and 86: 16 % 40 14 12 10 8 6 4 2 0 Iatrogen
- Page 87: Table 38: Mothers with babies diagn
- Page 91 and 92: 6 LABOUR AND BIRTH This chapter inc
- Page 93 and 94: Table 39: Maternal demographic char
- Page 95 and 96: Table 40: Gestation at birth among
- Page 97 and 98: Women given syntocinon prior to 3 c
- Page 99 and 100: 70 60 50 40 30 20 10 0 % NZ Europea
- Page 101 and 102: 6.5 Caesarean section WHA Maternity
- Page 103 and 104: Caesarean section rate 60 50 40 30
- Page 105 and 106: Sixty percent of para 1 women with
- Page 107 and 108: 6.6 Instrumental vaginal birth WHA
- Page 109 and 110: Table 52: Neonatal outcomes followi
- Page 111 and 112: 6.10 Obstetric analgesia WHA Matern
- Page 113 and 114: Table 56: GA use and mode of birth
- Page 115 and 116: Table 58: Interventions and outcome
- Page 117 and 118: Chaptern 7 LABOUR and BIRTH OUTCOME
- Page 119 and 120: 7 LABOUR and BIRTH OUTCOMES This ch
- Page 121 and 122:
7.2 Third stage management Methods:
- Page 123 and 124:
Table 61: Postpartum haemorrhage ra
- Page 125 and 126:
7.4 Emergency peripartum hysterecto
- Page 127 and 128:
Chaptern 8 POSTNATAL CARE 113
- Page 129 and 130:
8 POSTNATAL CARE This chapter provi
- Page 131 and 132:
% 90 85 80 75 70 65 60 55 50 45 40
- Page 133 and 134:
8.2 Postnatal admissions Methods Pr
- Page 135 and 136:
Table 70: Reason for admission to N
- Page 137 and 138:
Chaptern 9 NEWBORN SERVICES 123
- Page 139 and 140:
9 NEWBORN SERVICES This chapter pro
- Page 141 and 142:
9.2 NICU occupancy For 2010 the ver
- Page 143 and 144:
Number 700 600 500 400 300 200 100
- Page 145 and 146:
9.3.4 Reasons for admission to NICU
- Page 147 and 148:
9.4.3 Intraventricular haemorrhage
- Page 149 and 150:
246 for 2010. This number is higher
- Page 151 and 152:
9.4.8 Trends in the use of assisted
- Page 153 and 154:
9.4.10 Positive pressure ventilatio
- Page 155 and 156:
9.4.12 Term/post-term infants on as
- Page 157 and 158:
9.5.2 Survival of inborn babies (23
- Page 159 and 160:
20% 18% 16% 14% 12% 10% 8% 6% 4% AN
- Page 161 and 162:
9.5.10 Postnatal corticosteroids (A
- Page 163 and 164:
express milk for many weeks before
- Page 165 and 166:
9.9 Child Development Unit 9.9.1 Fo
- Page 167 and 168:
9.9.2 Development at 4 years of chi
- Page 169 and 170:
Chapter 10 PERINATAL MORTALITY 155
- Page 171 and 172:
10 PERINATAL MORTALITY This chapter
- Page 173 and 174:
Table 87: Perinatal related loss an
- Page 175 and 176:
10.5 Causes of perinatal-related de
- Page 177 and 178:
Chapter 11 SEVERE MATERNAL MORBIDIT
- Page 179 and 180:
11 SEVERE MATERNAL MORBIDITY This c
- Page 181 and 182:
Chapter 12 GYNAECOLOGY 167
- Page 183 and 184:
12 GYNAECOLOGY This chapter provide
- Page 185 and 186:
12.2 Termination of pregnancy Epsom
- Page 187 and 188:
12.3 Second trimester Termination o
- Page 189 and 190:
12.4 Gynaecology inpatient surgery
- Page 191 and 192:
Table 101: Demographic details of w
- Page 193 and 194:
ACHS Gynaecology Indicators: Injury
- Page 195 and 196:
12.5 Gynaecologic laparoscopic proc
- Page 197 and 198:
12.6 Hysterectomy Methods See Gynae
- Page 199 and 200:
% 80 70 60 50 40 30 20 10 0 Abdomin
- Page 201 and 202:
12.7 Urogynaecology Methods As in p
- Page 203 and 204:
Table 113: Complications of surgery
- Page 205 and 206:
12.8 Colposcopy Methods: The data p
- Page 207 and 208:
Referral smear cytology Table 117:
- Page 209 and 210:
The number of treatments and percen
- Page 211 and 212:
Number of patients 4.5 4 3.5 3 2.5
- Page 213 and 214:
12.9 Gynaecologic oncology surgical
- Page 215 and 216:
11.9.2 Gynaecologic oncology surger
- Page 217 and 218:
203
- Page 219 and 220:
Antenatal Summary screen; Reason fo
- Page 221 and 222:
Postnatal Mothers Destination to Wa
- Page 223 and 224:
APPENDIX 2. SUMMARY STATISTICS Tabl
- Page 225 and 226:
Table 135: Time trends in nullipari
- Page 227 and 228:
Table 141: Rates of smoking at book
- Page 229 and 230:
Table 149: LMC at birth and materna
- Page 231 and 232:
APPENDIX 4. ANTENATAL COMPLICATIONS
- Page 233 and 234:
Table 157: Demographic characterist
- Page 235 and 236:
4.4 Hypertensive disease Table 160:
- Page 237 and 238:
Table 164: LMC at birth and BMI (20
- Page 239 and 240:
APPENDIX 5. LABOUR AND BIRTH 5.1 In
- Page 241 and 242:
5.2 Outcomes following induction Ta
- Page 243 and 244:
Table 180: Mode of birth by LMC at
- Page 245 and 246:
5.5 Operative births Table 189: Pri
- Page 247 and 248:
Table 196: Referral for ECV (women
- Page 249 and 250:
APPENDIX 6. LABOUR and BIRTH OUTCOM
- Page 251 and 252:
APPENDIX 7. POSTNATAL CARE 7.1 Infa
- Page 253 and 254:
Table 213: Maternal destination fol
- Page 255 and 256:
Table 220: Admissions of inborn bab
- Page 257 and 258:
Table 224: Admissions of outborn ba
- Page 259 and 260:
8.2.5 Antenatal corticosteroids Tab
- Page 261 and 262:
8.3.2 Intraventricular haemorrhage
- Page 263 and 264:
8.4.1 Survival Table 240: Numbers o
- Page 265 and 266:
8.5.4 Patent Ductus Arteriosus Tabl
- Page 267 and 268:
Table 252: Inborn babies receiving
- Page 269 and 270:
APPENDIX 9. PERINATAL MORTALITY Tab
- Page 271 and 272:
Table 260: Cause of perinatal-relat
- Page 273 and 274:
10.2 Gynaecology Inpatient Surgery
- Page 275 and 276:
APPENDIX 11. GLOSSARY OF ABBREVIATI
- Page 277 and 278:
APPENDIX 12. DEFINITIONS Antepartum
- Page 279 and 280:
Lead Maternity Carer (LMC) The Lead
- Page 281:
Standard primipara A woman with no