To e Cai ni Legislatu Regula S in 2009-10 - Streetsblog San Francisco
To e Cai ni Legislatu Regula S in 2009-10 - Streetsblog San Francisco
To e Cai ni Legislatu Regula S in 2009-10 - Streetsblog San Francisco

You also want an ePaper? Increase the reach of your titles
YUMPU automatically turns print PDFs into web optimized ePapers that Google loves.
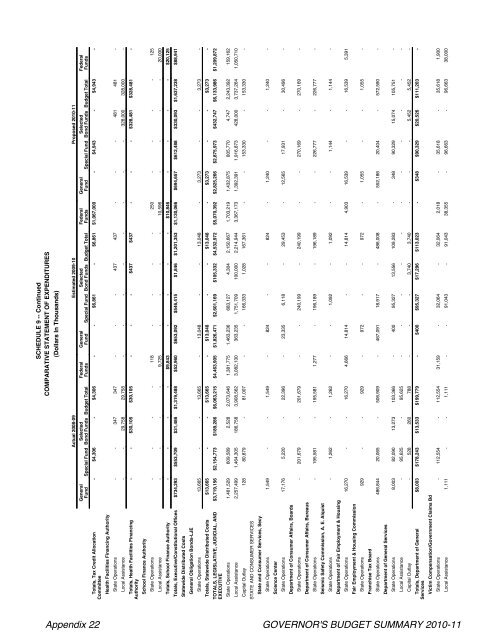
SCHEDULE 9 -- Cont<strong>in</strong>ued<br />
COMPARATIVE STATEMENT OF EXPENDITURES<br />
(Dollars In Thousands)<br />
Actual 2008-09 Estimated <strong>2009</strong>-<strong>10</strong> Proposed 20<strong>10</strong>-11<br />
General<br />
Selected<br />
Federal General<br />
Selected<br />
Federal General<br />
Selected<br />
Federal<br />
Fund Special Fund Bond Funds Budget <strong>To</strong>tal Funds Fund Special Fund Bond Funds Budget <strong>To</strong>tal Funds Fund Special Fund Bond Funds Budget <strong>To</strong>tal Funds<br />
<strong>To</strong>tals, Tax Credit Allocation<br />
- $4,306 - $4,306 - - $6,861 - $6,861 $1,067,000 - $4,943 - $4,943 -<br />
Committee<br />
Health Facilities F<strong>in</strong>anc<strong>in</strong>g Authority<br />
State Operations - - 347 347 - - - 437 437 - - - 481 481 -<br />
Local Assistance - - 29,758 29,758 - - - - - - - - 328,000 328,000 -<br />
- - $30,<strong>10</strong>5 $30,<strong>10</strong>5 - - - $437 $437 - - - $328,481 $328,481 -<br />
<strong>To</strong>tals, Health Facilities F<strong>in</strong>anc<strong>in</strong>g<br />
Authority<br />
School F<strong>in</strong>ance Authority<br />
State Operations - - - - 118 - - - - 250 - - - - 125<br />
Local Assistance - - - - 9,725 - - - - <strong>10</strong>,596 - - - - 20,000<br />
<strong>To</strong>tals, School F<strong>in</strong>ance Authority - - - - $9,843 - - - - $<strong>10</strong>,846 - - - - $20,125<br />
<strong>To</strong>tals, Executive/Constitutional Offices $734,293 $553,709 $31,486 $1,319,488 $52,960 $653,092 $546,415 $1,846 $1,201,353 $1,130,066 $694,657 $612,488 $330,093 $1,637,238 $88,941<br />
Statewide Distributed Costs<br />
General Obligation Bonds-LJE<br />
State Operations 13,665 - - 13,665 - 13,048 - - 13,048 - 3,273 - - 3,273 -<br />
<strong>To</strong>tals, Statewide Distributed Costs $13,665 - - $13,665 - $13,048 - - $13,048 - $3,273 - - $3,273 -<br />
TOTALS, LEGISLATIVE, JUDICIAL, AND $3,719,156 $2,154,773 $189,286 $6,063,215 $4,463,905 $1,826,471 $2,601,169 $<strong>10</strong>5,332 $4,532,972 $5,070,392 $2,825,266 $2,875,973 $432,747 $6,133,986 $1,209,872<br />
EXECUTIVE<br />
State Operations 1,461,529 609,589 2,528 2,073,646 1,381,775 1,463,236 683,127 4,304 2,150,667 1,703,219 1,432,875 805,770 4,747 2,243,392 159,162<br />
Local Assistance 2,257,499 1,464,305 186,758 3,908,562 3,082,130 363,235 1,751,709 <strong>10</strong>0,000 2,214,944 3,367,173 1,392,391 1,916,873 428,000 3,737,264 1,050,7<strong>10</strong><br />
Capital Outlay 128 80,879 - 81,007 - - 166,333 1,028 167,361 - - 153,330 - 153,330 -<br />
STATE AND CONSUMER SERVICES<br />
State and Consumer Services, Secy<br />
State Operations 1,549 - - 1,549 - 824 - - 824 - 1,240 - - 1,240 -<br />
Science Center<br />
State Operations 17,176 5,220 - 22,396 - 23,335 6,118 - 29,453 - 12,565 17,931 - 30,496 -<br />
Department of Consumer Affairs, Boards<br />
State Operations - 201,679 - 201,679 - - 240,199 - 240,199 - - 270,169 - 270,169 -<br />
Department of Consumer Affairs, Bureaus<br />
State Operations - 195,581 - 195,581 1,277 - 196,189 - 196,189 - - 226,777 - 226,777 -<br />
Seismic Safety Commission, A. E. Alquist<br />
State Operations - 1,262 - 1,262 - - 1,092 - 1,092 - - 1,144 - 1,144 -<br />
Department of Fair Employment & Hous<strong>in</strong>g<br />
State Operations 16,270 - - 16,270 4,666 14,814 - - 14,814 4,903 16,539 - - 16,539 5,391<br />
Fair Employment & Hous<strong>in</strong>g Commission<br />
State Operations 929 - - 929 - 972 - - 972 - 1,055 - - 1,055 -<br />
Franchise Tax Board<br />
State Operations 486,844 20,065 - 506,909 - 467,091 18,917 - 486,008 - 552,186 20,404 - 572,590 -<br />
Department of General Services<br />
State Operations 8,003 82,090 13,273 <strong>10</strong>3,366 - 400 95,327 13,556 <strong>10</strong>9,283 - 348 90,329 15,074 <strong>10</strong>5,751 -<br />
Local Assistance - 95,625 - 95,625 - - - - - - - - - - -<br />
Capital Outlay - 528 260 788 - - - 3,740 3,740 - - - 5,452 5,452 -<br />
<strong>To</strong>tals, Department of General<br />
$8,003 $178,243 $13,533 $199,779 - $400 $95,327 $17,296 $113,023 - $348 $90,329 $20,526 $111,203 -<br />
Services<br />
Victim Compensation/Government Claims Bd<br />
State Operations - 112,554 - 112,554 31,159 - 32,064 - 32,064 2,018 - 35,618 - 35,618 1,900<br />
Local Assistance 1,111 - - 1,111 - - 91,043 - 91,043 38,355 - 96,663 - 96,663 38,000<br />
Appendix 22 GOVERNOR'S BUDGET SUMMARY 20<strong>10</strong>-11