Aircraft Wake Detection Using Bistatic Radar: Analysis of ...
Aircraft Wake Detection Using Bistatic Radar: Analysis of ...
Aircraft Wake Detection Using Bistatic Radar: Analysis of ...

Create successful ePaper yourself
Turn your PDF publications into a flip-book with our unique Google optimized e-Paper software.
R. J. IANNUZZELLI ET AL.<br />
(a)<br />
Acoustic tone spectral power (dB)<br />
–30<br />
–40<br />
–50<br />
–60<br />
–70<br />
–80<br />
–5 0 5 10 15 20 25 30 35 40 45<br />
Elapsed time from C-130 overflight <strong>of</strong> common volume (s)<br />
(b)<br />
“Zero Doppler”<br />
spillover<br />
Vortex<br />
signature<br />
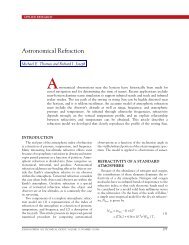
Figure 12 shows the acoustic amplitude, spectrogram,<br />
and single line spectrum for run 15. Again, the<br />
reader will find details on additional runs in Ref. 11.<br />
MODEL PREDICTIONS OF AIRCRAFT<br />
VORTEX WAKES<br />
Model calculations have been carried out for runs<br />
9 and 15 from 29 October. Our objectives were (1) to<br />
determine the extent to which the model could predict<br />
the early evolution (prior to breakup) <strong>of</strong> aircraft vortices<br />
and (2) to help interpret the radar measurements<br />
described in previous sections.<br />
Iannuzzelli-11a<br />
T = 63.69 s<br />
Obviously, some success in model validation is required<br />
if the model is to be used to provide estimates<br />
<strong>of</strong> the location, strength, and internal structure <strong>of</strong> the<br />
atmospheric flow signatures believed to be responsible<br />
for the measured radar returns. Accordingly, our approach<br />
was to first examine the predicted wake vortex<br />
trajectories and then to compare the predicted time <strong>of</strong><br />
arrival <strong>of</strong> the vortex cores at the radar common volume<br />
with the time at which radar signatures were observed.<br />
Since no ground-truth measurements <strong>of</strong> atmospheric<br />
motions were available during the BWI experiment,<br />
these were the only comparisons that could be used to<br />
help establish the model’s credibility. The next step in<br />
308 JOHNS HOPKINS APL TECHNICAL DIGEST, VOLUME 19, NUMBER 3 (1998)<br />
Spectral power (dB)<br />
–20<br />
–60<br />
–80<br />
–100<br />
–100<br />
–50<br />
Spillover<br />
C<br />
–40<br />
2 = 10 –12 n full<br />
volume; power across<br />
measured band<br />
Vortex signal<br />
2.2 m/s<br />
Phase noise<br />
0 50<br />
Doppler frequency (Hz)<br />
C 2 = 10 –12 n vortex volume;<br />
power across<br />
vortex circulation<br />
Figure 11. Run 9 on 29 October 1996: (a) acoustic line power, (b) spectrogram, and (c) single line through spectrogram.<br />
(c)<br />
100<br />
150