Aircraft Wake Detection Using Bistatic Radar: Analysis of ...
Aircraft Wake Detection Using Bistatic Radar: Analysis of ...
Aircraft Wake Detection Using Bistatic Radar: Analysis of ...

You also want an ePaper? Increase the reach of your titles
YUMPU automatically turns print PDFs into web optimized ePapers that Google loves.
R. J. IANNUZZELLI ET AL.<br />
THE CONNECTION BETWEEN SOUND PRESSURE LEVEL AND RADAR CROSS SECTION<br />
Applying the assumptions and analysis in Ref. 2, the<br />
variable can be related to the change in index <strong>of</strong> refraction<br />
induced by the sound waves by<br />
4 2 2 2<br />
=( 14 / ) k VC( nh) cos <br />
.<br />
In this equation, V C ~ (x) 3 / s is the common volume<br />
defined by the RF transmitter and receiver beam patterns<br />
in Fig. 2, and k is the RF wavenumber. The term nh is the<br />
amplitude <strong>of</strong> the index <strong>of</strong> refraction variations within this<br />
volume, which are represented as a train <strong>of</strong> plane waves,<br />
Acoustic<br />
line<br />
n = nhcos[ka(z vst)] ,<br />
where v s is the sound speed and k a is the acoustic wavenumber.<br />
The change in index <strong>of</strong> refraction can be related to the<br />
acoustic pressure by<br />
n =K()=K(p)/v s ,<br />
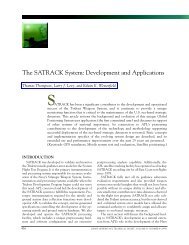
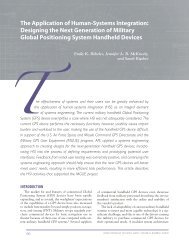
“Zero Doppler”<br />
spillover<br />
T = 63.69 s<br />
Figure 3. Spectrogram <strong>of</strong> run 9 on 29 October 1996 (10-kHz bandwidth).<br />
where K (by definition) is the Gladstone-Dale constant and<br />
is the air density. The acoustic pressure (p), in turn, is<br />
related to the intensity <strong>of</strong> the sound waves in the common<br />
volume by<br />
p =2(v s)I,<br />
where the intensity is given by<br />
I =[Paga/(4h 2 )] exp(2h).<br />
Here, P a is the power <strong>of</strong> the acoustic source, g a is the<br />
acoustic antenna gain, and h is the distance from the acoustic<br />
source to the center <strong>of</strong> the common volume. The variable<br />
is the absorption coefficient, which depends on the acoustic<br />
frequency, the transport properties <strong>of</strong> air, and the relative<br />
humidity. For the range <strong>of</strong> altitudes and frequencies <strong>of</strong> interest<br />
in the present work, is negligibly small, even at<br />
100% relative humidity. The bracketed expression given in<br />
Eq. 9 in the text results from using the above relationships,<br />
with set equal to zero.<br />
component <strong>of</strong> the vortex velocity<br />
field parallel to the acoustic axis.<br />
Because these variables are distributed<br />
nonuniformly, we might<br />
expect to see the Doppler spectrum<br />
broaden from a line to a<br />
continuous spectrum <strong>of</strong> width<br />
(f d) max as the vortex wake moves<br />
into the common volume. This<br />
was not the case, however; observations<br />
showed a large signal<br />
dropout correlating with the arrival<br />
<strong>of</strong> the descending wake (see the<br />
Results section for a discussion).<br />
PROCESSING<br />
Receiver Processing<br />
Figure 4 is a block diagram <strong>of</strong><br />
the receiver processing. Both<br />
channels—the main vortex channel<br />
that is collecting information<br />
from the common volume (as well<br />
as spillover from sidelobes) and the<br />
reference channel—are mixed to<br />
approximately 25 kHz. From there,<br />
both channels are sent through a<br />
bandpass anti-alias filter. The data<br />
302 JOHNS HOPKINS APL TECHNICAL DIGEST, VOLUME 19, NUMBER 3 (1998)