Aircraft Wake Detection Using Bistatic Radar: Analysis of ...
Aircraft Wake Detection Using Bistatic Radar: Analysis of ...
Aircraft Wake Detection Using Bistatic Radar: Analysis of ...

You also want an ePaper? Increase the reach of your titles
YUMPU automatically turns print PDFs into web optimized ePapers that Google loves.
R. J. IANNUZZELLI ET AL.<br />
in which the transmitter and receiver are spatially<br />
separated, can be shown to be<br />
P<br />
R<br />
2<br />
PGG T T R<br />
= v(<br />
VC ∩VV),<br />
3 2 2<br />
( 4)<br />
R R<br />
T R<br />
(1)<br />
where<br />
PT = transmitter power,<br />
GT and GR = transmitter and receiver antenna gains,<br />
respectively,<br />
= wavelength,<br />
RT and RR = ranges from the transmitter and receiver<br />
to the intersection <strong>of</strong> the two antenna beams,<br />
respectively,<br />
v =reflectivity <strong>of</strong> volume clutter (expressed in m2 /<br />
m3 ),<br />
VC = the common volume, which is contained within<br />
the intersection <strong>of</strong> the transmitter’s and<br />
receiver’s conical beams, and<br />
VV = vortex volume.<br />
For a monostatic radar, the ranges are identical.<br />
From Ref. 2, clear air turbulence reflectivity v can<br />
be expressed as<br />
4<br />
= 2k [ 2k sin( / 2)]<br />
, (2)<br />
v S<br />
where k = 2/ is the radar wavenumber, and S is the<br />
scattering angle, i.e., the angle at which the radar<br />
energy is bent at the common volume from the transmitter<br />
toward the receiver (180° for the monostatic<br />
case). The spectral representation <strong>of</strong> the turbulence is<br />
given by<br />
2 −11/<br />
3<br />
n<br />
( ) = 0. 033C ,<br />
(3)<br />
where is the spatial wavenumber, and 2<br />
C is a struc-<br />
n<br />
ture parameter that measures the intensity <strong>of</strong> turbulent<br />
fluctuations. For the special case <strong>of</strong> homogeneous isotropic<br />
turbulence, 2<br />
C can be expressed in terms <strong>of</strong> the<br />
n<br />
more general structure Dn(r) using<br />
where<br />
2 2/ 3<br />
Cn = r Dn() r<br />
− , (4)<br />
[ ] 2<br />
Dn() r ≡ n( x + r) − n() x<br />
(5)<br />
is the structure function, and r is a spatial increment. The<br />
variable n in Eq. 5 is the refractive index <strong>of</strong> air, which<br />
is related to meteorological variables (temperature,<br />
pressure, humidity). The overbar indicates an ensemble<br />
average. Values <strong>of</strong> 2 16 2/3<br />
C can range from 10 m n<br />
for weak turbulence to 10 12 m 2/3 for very strong<br />
turbulence. 3,4<br />
Vortex detection by radar poses several challenges<br />
to the radar designer. Most <strong>of</strong> the problems arise because<br />
the vortex provides little radar return. Since<br />
most <strong>of</strong> the refraction will be away from the radar<br />
transmitter (Ref. 1), a bistatic arrangement is favored.<br />
The biggest problem with the bistatic continuouswave<br />
radar is the performance degradation due to<br />
phase noise from the spillover signal. Unlike pulse<br />
radars, a continuous-wave radar is both transmitting<br />
and receiving all the time. Time gating, which isolates<br />
a pulse radar receiver from the transmitter, does not<br />
apply with a continuous-wave radar, so other means <strong>of</strong><br />
isolating the high spillover signal from the transmitter<br />
into the receiver must be used. We applied several<br />
techniques to reduce spillover at BWI, including construction<br />
<strong>of</strong> fences around the transmitter and receiver<br />
shelter and separation and pointing <strong>of</strong> the receiver/<br />
transmitter so that sidelobe patterns could help null<br />
out as much <strong>of</strong> the direct spillover as possible. In<br />
addition, we experimented with an active nuller 1 and<br />
adaptive processing, which will be described later in<br />
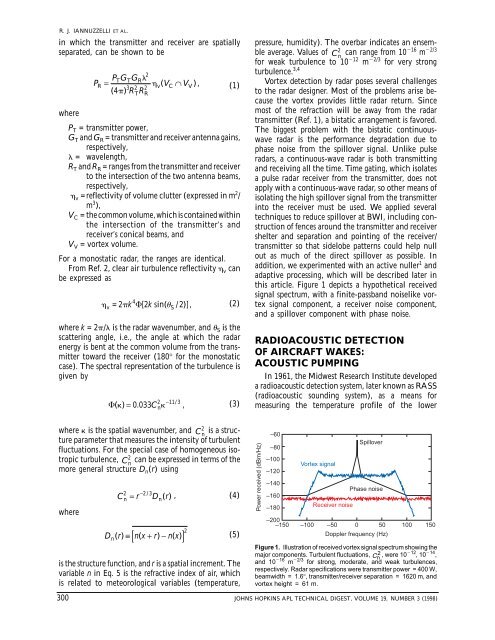
this article. Figure 1 depicts a hypothetical received<br />
signal spectrum, with a finite-passband noiselike vortex<br />
signal component, a receiver noise component,<br />
and a spillover component with phase noise.<br />
RADIOACOUSTIC DETECTION<br />
OF AIRCRAFT WAKES:<br />
ACOUSTIC PUMPING<br />
In 1961, the Midwest Research Institute developed<br />
a radioacoustic detection system, later known as RASS<br />
(radioacoustic sounding system), as a means for<br />
measuring the temperature pr<strong>of</strong>ile <strong>of</strong> the lower<br />
300 JOHNS HOPKINS APL TECHNICAL DIGEST, VOLUME 19, NUMBER 3 (1998)<br />
Power received (dBm/Hz)<br />
–60<br />
–80<br />
–100<br />
–120<br />
–140<br />
–160<br />
–180<br />
Vortex signal<br />
Receiver noise<br />
Spillover<br />
Phase noise<br />
–200 –150 –100 –50 0 50 100 150<br />
Doppler frequency (Hz)<br />
Figure 1. Illustration <strong>of</strong> received vortex signal spectrum showing the<br />
major components. Turbulent fluctuations, C n 2 , were 10 12 , 10 14 ,<br />
and 10 16 m 2/3 for strong, moderate, and weak turbulences,<br />
respectively. <strong>Radar</strong> specifications were transmitter power = 400 W,<br />
beamwidth = 1.6°, transmitter/receiver separation = 1620 m, and<br />
vortex height = 61 m.