Aircraft Wake Detection Using Bistatic Radar: Analysis of ...
Aircraft Wake Detection Using Bistatic Radar: Analysis of ...
Aircraft Wake Detection Using Bistatic Radar: Analysis of ...

Create successful ePaper yourself
Turn your PDF publications into a flip-book with our unique Google optimized e-Paper software.
R. J. IANNUZZELLI ET AL.<br />
(a)<br />
Height (m)<br />
(b)<br />
Height (m)<br />
120<br />
100<br />
80<br />
60<br />
40<br />
20<br />
0<br />
–60 –40 –20 0<br />
Crosstrack (m)<br />
20 40<br />
120<br />
100<br />
80<br />
60<br />
40<br />
20<br />
0<br />
–60 –40 –20 0<br />
Crosstrack (m)<br />
20 40<br />
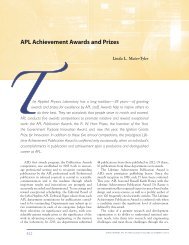
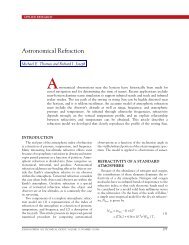
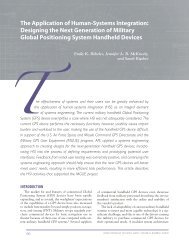
Figure 14. Contours <strong>of</strong> turbulence kinetic energy for run 9 at<br />
times late <strong>of</strong> (a) 1.4 s, and (b) 31.0 s.<br />
the larger are these temporary local variations in the<br />
refractive index.<br />
The physical variable most identified with radar<br />
signatures is the structure parameter 2<br />
C discussed pre-<br />
n<br />
viously. To effectively use the model predictions to<br />
interpret the radar observations, a means must be<br />
found to relate 2<br />
C to the mean-flow and turbulence<br />
n<br />
variables predicted by AWEC.<br />
An algebraic expression for 2<br />
C in terms <strong>of</strong> selected<br />
n<br />
AWEC model variables has been derived for a special<br />
case <strong>of</strong> zero moisture content in the atmosphere, 11<br />
2 2<br />
2 a ( 77. 6R)<br />
Cn= − ′ v′<br />
w ,<br />
1/3 4<br />
10<br />
y z<br />
∂ ⎛ ⎞<br />
⎜ − ′<br />
′∂ ⎟<br />
⎝ ∂ ∂ ⎠<br />
60<br />
60<br />
(17)<br />
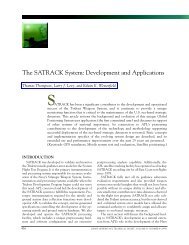
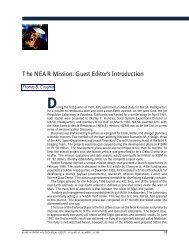
Figure 15. Vortex trajectories for (a) run 9 and (b) run 15. The<br />
position <strong>of</strong> the vortex cores (solid curve) is plotted as a function <strong>of</strong><br />
time late. The heavy dashed line indicates where the vortex<br />
positions would be if the wake descended at a constant velocity<br />
given by the induced velocity computed from Eq. 16. The actual<br />
vortex descent begins near this speed but then slows. The fixed<br />
upper and lower boundaries <strong>of</strong> the common volume are indicated<br />
by a pair <strong>of</strong> solid horizontal lines. The outlying lighter dotted lines<br />
indicate the first contour level above ambient <strong>of</strong> the turbulence<br />
kinetic energy distribution.<br />
where is the turbulence dissipation rate, ′ v ′ and<br />
′ w ′ are turbulence density-velocity correlations, and<br />
∂/ ∂y<br />
and ∂/ ∂z<br />
are gradients <strong>of</strong> the mean potential<br />
density14 in the horizontal (cross-track or y) and vertical<br />
directions, respectively. Constants appearing in<br />
Eq. 17 are the universal gas constant R and a2 , which<br />
ranges between 0.4 and 4. A value <strong>of</strong> a2 = 1.0 was<br />
2<br />
chosen for estimating Cn in this study.<br />
Figure 16a shows that the wake boundary as determined<br />
by the structure parameter roughly coincides<br />
with the outer contour <strong>of</strong> turbulence kinetic energy for<br />
run 15, which is shown for comparison in Fig. 16b.<br />
Unlike the turbulence kinetic energy, however, the<br />
2<br />
plot <strong>of</strong> Cn shows evidence <strong>of</strong> structure within the<br />
vortex wake. Values <strong>of</strong> 2<br />
C range from 30 to 70 dB<br />
n<br />
over the extent <strong>of</strong> the recirculation cell, with the<br />
312 JOHNS HOPKINS APL TECHNICAL DIGEST, VOLUME 19, NUMBER 3 (1998)<br />
Height (m)<br />
(a)<br />
(b)<br />
Height (m)<br />
120<br />
100<br />
80<br />
60<br />
40<br />
20<br />
0<br />
0<br />
120<br />
100<br />
80<br />
60<br />
40<br />
20<br />
0<br />
0<br />
20<br />
20<br />
Time (s)<br />
Time (s)<br />
40<br />
40<br />
60<br />
60