Aircraft Wake Detection Using Bistatic Radar: Analysis of ...
Aircraft Wake Detection Using Bistatic Radar: Analysis of ...
Aircraft Wake Detection Using Bistatic Radar: Analysis of ...

Create successful ePaper yourself
Turn your PDF publications into a flip-book with our unique Google optimized e-Paper software.
R. J. IANNUZZELLI ET AL.<br />
more apparent after adaptive processing.<br />
The formulation for this<br />
adaptive process assumes that the<br />
main vortex channel has two components:<br />
the common volume<br />
component and the direct spillover<br />
component. The reference<br />
channel is first phase-shifted and<br />
scaled to match the zero-Doppler<br />
magnitude and phase <strong>of</strong> the vortex<br />
channel peak, and then subtracted.<br />
The subtraction is performed in<br />
the frequency domain before the<br />
magnitude is taken. This has typically<br />
reduced the power in the<br />
zero-Doppler component in the<br />
main vortex channel by as much as<br />
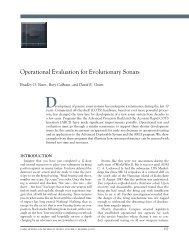
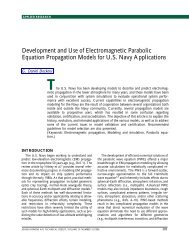
30 dB. Figure 6 is a block diagram<br />
<strong>of</strong> the adaptive processing, which<br />
Vortex<br />
I/Q<br />
data<br />
Data buffering<br />
several seconds<br />
<strong>of</strong> data<br />
can be contrasted to the spectrogram processing depicted<br />
in Fig. 5. Many runs were looked at with this<br />
process, and for those <strong>of</strong> importance on 29 October,<br />
adaptive processing was not needed since the returns<br />
were quite large.<br />
THE BWI EXPERIMENT<br />
Both the Maryland Aviation Administration and<br />
the FAA where extremely helpful and receptive to the<br />
idea <strong>of</strong> allowing APL to install and operate the bistatic<br />
radar on the south side <strong>of</strong> runway 33L (Fig. 7). As<br />
mentioned previously, because <strong>of</strong> the proximity <strong>of</strong> the<br />
test site to a highway, wire screen fences (Fig. 8) were<br />
installed around both locations. This cut down reflections<br />
from cars as well as the direct path signal from<br />
the transmitter to the receiver.<br />
The traffic interference can be recognized in waterfall<br />
spectra as a double S-shaped curve with an inflection<br />
point at zero Doppler (Fig. 3). This region <strong>of</strong> zero<br />
Doppler occurs when the vehicle is midway between<br />
the transmitter and receiver and the rate <strong>of</strong> change <strong>of</strong><br />
the sum <strong>of</strong> the ray paths from the transmitter and the<br />
receiver to the vehicle is zero. At times prior to this<br />
there is a decreasing positive rate <strong>of</strong> change (positive<br />
Doppler); after the midway point there is an increasing<br />
negative Doppler. The maximum positive and negative<br />
velocity is limited to that <strong>of</strong> a monostatic radar<br />
with a completely radial component. Traffic interference<br />
can be seen in the actual waterfall data <strong>of</strong> Fig.<br />
3 as depicted in Fig. 9.<br />
Initial checkout <strong>of</strong> the system consisted <strong>of</strong> antenna<br />
alignment testing followed by measurement <strong>of</strong> receiver<br />
signal levels in clear air, both with and without acoustic<br />
pumping. Also, with the runway out <strong>of</strong> service, the<br />
acoustic transmitter was moved to several locations<br />
along its centerline, and receiver signal levels were<br />
Windowing<br />
20 log ( )<br />
304 JOHNS HOPKINS APL TECHNICAL DIGEST, VOLUME 19, NUMBER 3 (1998)<br />
FFT<br />
FFTndsize Possible<br />
zero padding<br />
Data buffering<br />
several seconds<br />
<strong>of</strong> data<br />
Reference<br />
I/Q<br />
data<br />
FFTdsize<br />
data<br />
points<br />
FFT<br />
FFTsize<br />
data<br />
points<br />
Complex data<br />
Reference channel<br />
phase-shifted and<br />
subtracted from main<br />
vortex channel<br />
Real data<br />
IIR<br />
filter<br />
Average<br />
time constant<br />
Figure 6. Block diagram <strong>of</strong> adaptive spectrogram FFT processing.<br />
Output FFT line<br />
(FFTndsize* sample<br />
period in seconds)<br />
Lower<br />
limit<br />
monitored. During this phase <strong>of</strong> testing, the acoustic<br />
transmitter consisted <strong>of</strong> a Peavy 44T compression driver<br />
loaded with a 60° horn, which was typically driven<br />
with less than 20 W. A digital synthesizer was used to<br />
generate a sinusoidal input to the amplifier, which<br />
could be varied in frequency.<br />
Tests confirmed that the optimal orientation <strong>of</strong> the<br />
acoustic source was vertical and directly in line between<br />
the transmitter and receiver along the centerline<br />
<strong>of</strong> the runway; i.e., at about 79 m from the south<br />
end <strong>of</strong> the runway. Unfortunately, commercial aircraft<br />
are at a very low altitude as they pass over this point,<br />
perhaps ≈50 m or less. At this altitude, a vortex can<br />
be unstable and dissipate quickly. To allow better control<br />
<strong>of</strong> the test environment, arrangements were made<br />
for a NASA C-130 aircraft from Wallops Island, Virginia,<br />
to overfly the runway on several days. These<br />
flights were funded by NASA as a contribution to the<br />
APL research efforts.<br />
Test <strong>Aircraft</strong><br />
The C-130 aircraft was equipped with smoke<br />
generators (smokers) installed on both wingtips. The<br />
smokers burned corvus or canopus oil at the wingtip,<br />
which caused the smoke to became entrapped in the<br />
vortex core (see Fig. 10). The entrapped smoke allowed<br />
visual tracking <strong>of</strong> the otherwise invisible vortex.<br />
The right-tip smoker was inoperative for the first two<br />
test dates owing to a defective switch in the cockpit;<br />
however, both tip smokers were operational during the<br />
third and final test date.<br />
Pretest instructions required the C-130 crew to fly<br />
the glide slope until reaching the requested altitude,<br />
which was to be held until the aircraft passed 305 m<br />
beyond the runway threshold. To conserve the corvus<br />
oil, the smoke was to be turned on 305 m prior to the