ICDD PDF-4+ 2012 Instructions
ICDD PDF-4+ 2012 Instructions
ICDD PDF-4+ 2012 Instructions

You also want an ePaper? Increase the reach of your titles
YUMPU automatically turns print PDFs into web optimized ePapers that Google loves.
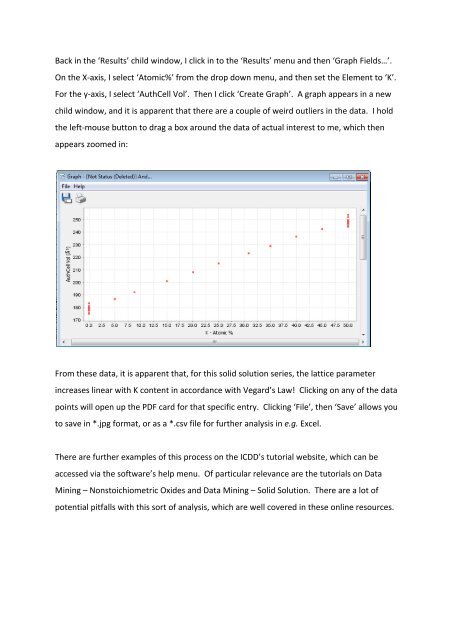
Back in the ‘Results’ child window, I click in to the ‘Results’ menu and then ‘Graph Fields…’.<br />
On the X-‐axis, I select ‘Atomic%’ from the drop down menu, and then set the Element to ‘K’.<br />
For the y-‐axis, I select ‘AuthCell Vol’. Then I click ‘Create Graph’. A graph appears in a new<br />
child window, and it is apparent that there are a couple of weird outliers in the data. I hold<br />
the left-‐mouse button to drag a box around the data of actual interest to me, which then<br />
appears zoomed in:<br />
From these data, it is apparent that, for this solid solution series, the lattice parameter<br />
increases linear with K content in accordance with Vegard’s Law! Clicking on any of the data<br />
points will open up the <strong>PDF</strong> card for that specific entry. Clicking ‘File’, then ‘Save’ allows you<br />
to save in *.jpg format, or as a *.csv file for further analysis in e.g. Excel.<br />
There are further examples of this process on the <strong>ICDD</strong>’s tutorial website, which can be<br />
accessed via the software’s help menu. Of particular relevance are the tutorials on Data<br />
Mining – Nonstoichiometric Oxides and Data Mining – Solid Solution. There are a lot of<br />
potential pitfalls with this sort of analysis, which are well covered in these online resources.