Capital Budgeting Techniques: Certainty and Risk
Capital Budgeting Techniques: Certainty and Risk
Capital Budgeting Techniques: Certainty and Risk

Create successful ePaper yourself
Turn your PDF publications into a flip-book with our unique Google optimized e-Paper software.
360 PART 3 Long-Term Investment Decisions<br />
scenario analysis<br />
A behavioral approach that<br />
evaluates the impact on the<br />
firm’s return of simultaneous<br />
changes in a number of<br />
variables.<br />
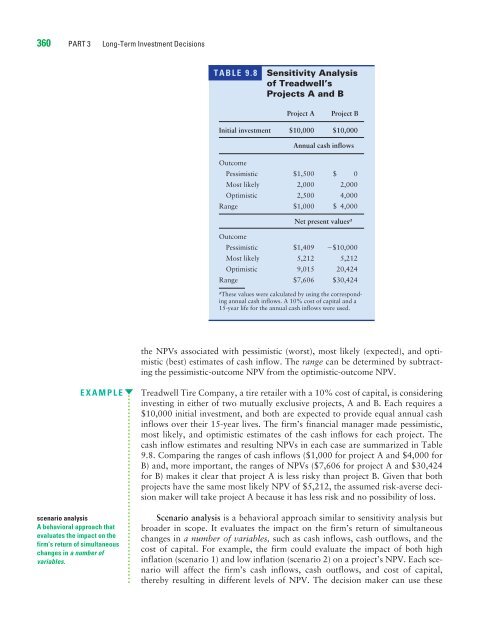
TABLE 9.8 Sensitivity Analysis<br />
of Treadwell’s<br />
Projects A <strong>and</strong> B<br />
Project A Project B<br />
Initial investment $10,000 $10,000<br />
Annual cash inflows<br />
Outcome<br />
Pessimistic $1,500 $ 0<br />
Most likely 2,000 2,000<br />
Optimistic 2,500 4,000<br />
Range $1,000 $ 4,000<br />
Net present values a<br />
Outcome<br />
Pessimistic $1,409 $10,000<br />
Most likely 5,212 5,212<br />
Optimistic 9,015 20,424<br />
Range $7,606 $30,424<br />
a These values were calculated by using the corresponding<br />
annual cash inflows. A 10% cost of capital <strong>and</strong> a<br />
15-year life for the annual cash inflows were used.<br />
the NPVs associated with pessimistic (worst), most likely (expected), <strong>and</strong> optimistic<br />
(best) estimates of cash inflow. The range can be determined by subtracting<br />
the pessimistic-outcome NPV from the optimistic-outcome NPV.<br />
EXAMPLE Treadwell Tire Company, a tire retailer with a 10% cost of capital, is considering<br />
investing in either of two mutually exclusive projects, A <strong>and</strong> B. Each requires a<br />
$10,000 initial investment, <strong>and</strong> both are expected to provide equal annual cash<br />
inflows over their 15-year lives. The firm’s financial manager made pessimistic,<br />
most likely, <strong>and</strong> optimistic estimates of the cash inflows for each project. The<br />
cash inflow estimates <strong>and</strong> resulting NPVs in each case are summarized in Table<br />
9.8. Comparing the ranges of cash inflows ($1,000 for project A <strong>and</strong> $4,000 for<br />
B) <strong>and</strong>, more important, the ranges of NPVs ($7,606 for project A <strong>and</strong> $30,424<br />
for B) makes it clear that project A is less risky than project B. Given that both<br />
projects have the same most likely NPV of $5,212, the assumed risk-averse decision<br />
maker will take project A because it has less risk <strong>and</strong> no possibility of loss.<br />
Scenario analysis is a behavioral approach similar to sensitivity analysis but<br />
broader in scope. It evaluates the impact on the firm’s return of simultaneous<br />
changes in a number of variables, such as cash inflows, cash outflows, <strong>and</strong> the<br />
cost of capital. For example, the firm could evaluate the impact of both high<br />
inflation (scenario 1) <strong>and</strong> low inflation (scenario 2) on a project’s NPV. Each scenario<br />
will affect the firm’s cash inflows, cash outflows, <strong>and</strong> cost of capital,<br />
thereby resulting in different levels of NPV. The decision maker can use these