Capital Budgeting Techniques: Certainty and Risk
Capital Budgeting Techniques: Certainty and Risk
Capital Budgeting Techniques: Certainty and Risk

You also want an ePaper? Increase the reach of your titles
YUMPU automatically turns print PDFs into web optimized ePapers that Google loves.
LG4<br />
LG5<br />
CHAPTER 9 <strong>Capital</strong> <strong>Budgeting</strong> <strong>Techniques</strong>: <strong>Certainty</strong> <strong>and</strong> <strong>Risk</strong> 381<br />
a. Use the internal rate of return (IRR) approach to select the best group of<br />
projects.<br />
b. Use the net present value (NPV) approach to select the best group of<br />
projects.<br />
c. Compare, contrast, <strong>and</strong> discuss your findings in parts a <strong>and</strong> b.<br />
d. Which projects should the firm implement? Why?<br />
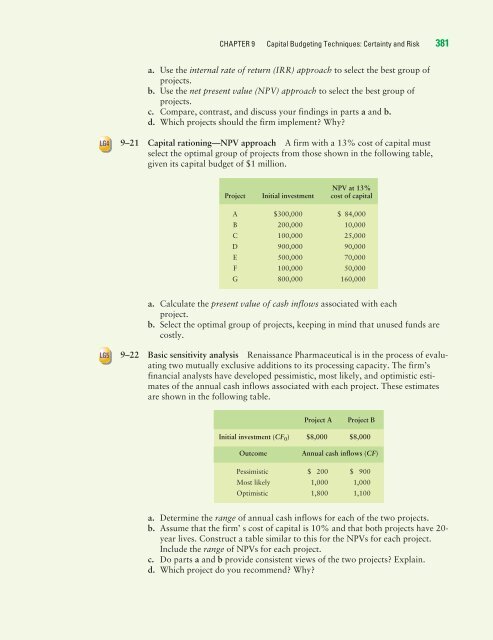
9–21 <strong>Capital</strong> rationing—NPV approach A firm with a 13% cost of capital must<br />
select the optimal group of projects from those shown in the following table,<br />
given its capital budget of $1 million.<br />
NPV at 13%<br />
Project Initial investment cost of capital<br />
A $300,000 $ 84,000<br />
B 200,000 10,000<br />
C 100,000 25,000<br />
D 900,000 90,000<br />
E 500,000 70,000<br />
F 100,000 50,000<br />
G 800,000 160,000<br />
a. Calculate the present value of cash inflows associated with each<br />
project.<br />
b. Select the optimal group of projects, keeping in mind that unused funds are<br />
costly.<br />
9–22 Basic sensitivity analysis Renaissance Pharmaceutical is in the process of evaluating<br />
two mutually exclusive additions to its processing capacity. The firm’s<br />
financial analysts have developed pessimistic, most likely, <strong>and</strong> optimistic estimates<br />
of the annual cash inflows associated with each project. These estimates<br />
are shown in the following table.<br />
Project A Project B<br />
Initial investment (CF 0) $8,000 $8,000<br />
Outcome Annual cash inflows (CF)<br />
Pessimistic $ 200 $ 900<br />
Most likely 1,000 1,000<br />
Optimistic 1,800 1,100<br />
a. Determine the range of annual cash inflows for each of the two projects.<br />
b. Assume that the firm’ s cost of capital is 10% <strong>and</strong> that both projects have 20year<br />
lives. Construct a table similar to this for the NPVs for each project.<br />
Include the range of NPVs for each project.<br />
c. Do parts a <strong>and</strong> b provide consistent views of the two projects? Explain.<br />
d. Which project do you recommend? Why?