LEWIS SMITH LAKE - Auburn University
LEWIS SMITH LAKE - Auburn University
LEWIS SMITH LAKE - Auburn University

You also want an ePaper? Increase the reach of your titles
YUMPU automatically turns print PDFs into web optimized ePapers that Google loves.
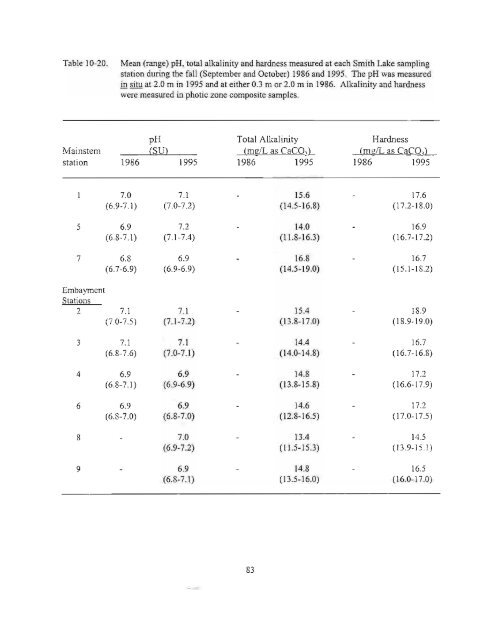
Table 10-20. Mean (range) pH, total alkalinity and hardness measured at each Smith Lake sampling<br />
station during the fall (September and October) 1986 and 1995. The pH was measured<br />
in situ at 2.0 m in 1995 and at either 0.3 m or 2.0 m in 1986. Alkalinity and hardness<br />
were measured in photic zone composite samples.<br />
Mainstem<br />
station<br />
pH<br />
(Sill<br />
1986 1995<br />
Total Alkalinity<br />
(mgJL as CaCO,L<br />
1986 1995<br />
Hardness<br />
(mgJL as CaCO,L<br />
1986 1995<br />
7.0 7.1 15.6 17.6<br />
(6.9-7.1) (7.0-7.2) (14.5-16.8) (17.2-18.0)<br />
5 6.9 7.2 14.0 16.9<br />
(6.8-7.1) (7.1-7.4) (11.8-16.3) (16.7-17.2)<br />
7 6.8 6.9 16.8 16.7<br />
(6.7-6.9) (6.9-6.9) (14.5-19.0) (15.1-18.2)<br />
Embayment<br />
Stations<br />
2 7.1 7.1 15.4 18.9<br />
(7.0-7.5) (7.1-7.2) (13.8-17.0) (18.9-19.0)<br />
3 7.1 7.1 14.4 16.7<br />
(6.8-7.6) (7.0-7.1) (14.0-14.8) (16.7-16.8)<br />
4 6.9 6.9 14.8 17.2<br />
(6.8-7.1) (6.9-6.9) (13.8-15.8) (16.6-17.9)<br />
6 6.9 6.9 14.6 17.2<br />
(6.8-7.0) (6.8-7.0) (12.8-16.5) (17.0-17.5)<br />
8 7.0 13.4 14.5<br />
(6.9-7.2) (11.5-15.3) (13.9-15.1)<br />
9 6.9 14.8 16.5<br />
(6.8-7.1) (13.5-16.0) (16.0-17.0)<br />
83