LEWIS SMITH LAKE - Auburn University
LEWIS SMITH LAKE - Auburn University
LEWIS SMITH LAKE - Auburn University

Create successful ePaper yourself
Turn your PDF publications into a flip-book with our unique Google optimized e-Paper software.
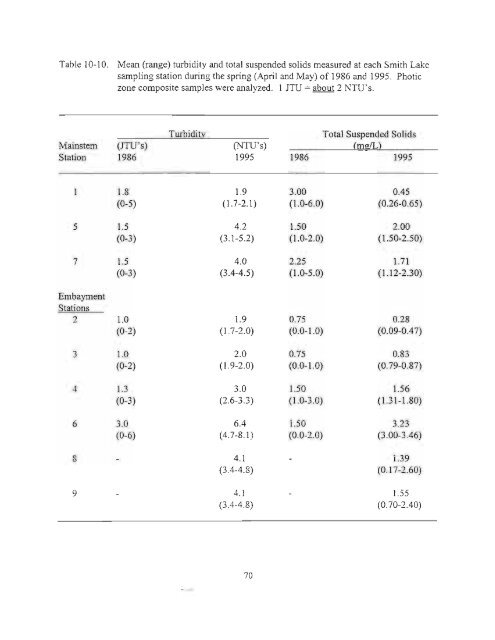
Table 10-10. Mean (range) turbidity and total suspended solids measured at each Smith Lake<br />
sampling station during the spring (April and May) of 1986 and 1995. Photic<br />
zone composite samples were analyzed. I JTV = about 2 NTV's.<br />
Mainstem<br />
Station<br />
(JTV's)<br />
1986<br />
Turbidity<br />
(NTU's)<br />
1995<br />
Total Suspended Solids<br />
(mgIL)<br />
1986 1995<br />
I 1.8 1.9 3.00 0.45<br />
(0-5) (1.7-2.1) (1.0-6.0) (0.26-0.65)<br />
5 1.5 4.2 1.50 2.00<br />
(0-3) (3.1-5.2) (1.0-2.0) (1.50-2.50)<br />
7 1.5 4.0 2.25 1.71<br />
(0-3) (3.4-4.5) (1.0-5.0) (1.12-2.30)<br />
Embayment<br />
Stations<br />
2 1.0 1.9 0.75 0.28<br />
(0-2) (1.7-2.0) (0.0-1.0) (0.09-0.47)<br />
3 1.0 2.0 0.75 0.83<br />
(0-2) (1.9-2.0) (0.0-1.0) (0.79-0.87)<br />
4 1.3 3.0 1.50 1.56<br />
(0-3) (2.6-3.3) (1.0-3.0) (1.31-1.80)<br />
6 3.0 6.4 1.50 3.23<br />
(0-6) (4.7-8.1) (0.0-2.0) (3.00-3.46)<br />
8 4.1 1.39<br />
(3.4-4.8) (0.17-2.60)<br />
9 4.1 1.55<br />
(3.4-4.8) (0.70-2.40)<br />
70