LEWIS SMITH LAKE - Auburn University
LEWIS SMITH LAKE - Auburn University
LEWIS SMITH LAKE - Auburn University

Create successful ePaper yourself
Turn your PDF publications into a flip-book with our unique Google optimized e-Paper software.
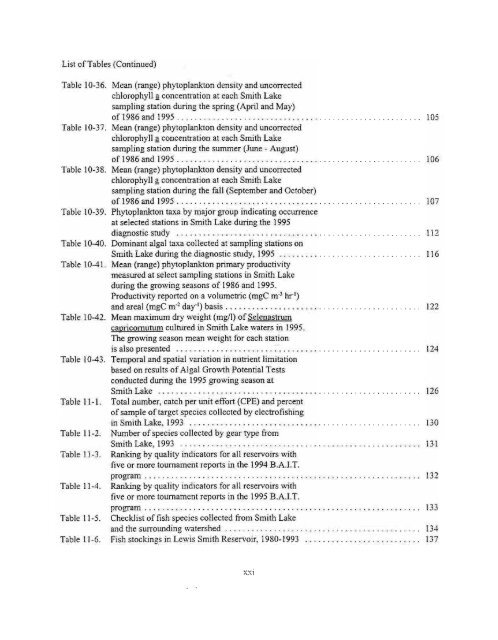
List ofTables (Continued)<br />
Table 10-36. Mean (range) phytoplankton density and uncorrected<br />
chlorophyll!! concentration at each Smith Lake<br />
sampling station during the spring (April and May)<br />
of 1986 and 1995 . . . . . . . . . . . . . . . . . . . . . . . . . . . . . . . . . • . . . . . . . . . . . . . . . . . . . .. 105<br />
Table 10-37. Mean (range) phytoplankton density and uncorrected<br />
chlorophyll!! concentration at each Smith Lake<br />
sampling station during the summer (June. August)<br />
of!986 and 1995 . . . . . . . . . . . . . . . . . . . . . . . . . . . . . . . . . . . . . . . . . . . . . . . . . . . . . .. 106<br />
Table 10-38. Mean (range) phytoplankton density and uncorrected<br />
chlorophyll!! concentration at each Smith Lake<br />
sampling station during the fall (September and October)<br />
of 1986 and 1995 107<br />
Table 10-39. Phytoplankton taxa by major group indicating occurrence<br />
at selected stations in Smith Lake during the 1995<br />
diagnostic study 112<br />
Table 10-40. Dominant algal taxa collected at sampling stations on<br />
Smith Lake during the diagnostic study, 1995 116<br />
Table 10-41. Mean (range) phytoplankton primary productivity<br />
measured at select sampling stations in Smith Lake<br />
during the growing seasons of 1986 and 1995.<br />
Productivity reported on a volumetric (mgC m" hr'l)<br />
and areal (mgC m" day") basis. . . . . . . . . . . . . . . . . . . . . . . . . . • . . . . . . . . . . . . . . . .. 122<br />
Table 10-42. Mean maximum dry weight (mg/l) ofSelenastrurn<br />
capricomutum cultured in Smith Lake waters in 1995.<br />
The growing season mean weight for each station<br />
is also presented 124<br />
Table 10-43. Temporal and spatial variation in nutrient limitation<br />
based on results ofAlgal Growth Potential Tests<br />
conducted during the 1995 growing season at<br />
Smith Lake 126<br />
Table II-I. Total number, catch per unit effort (CPE) and percent<br />
ofsample of target species collected by electrofishing<br />
in Smith Lake, 1993 130<br />
Table 11-2. Number ofspecies collected by gear type from<br />
Smith Lake, 1993 13 I<br />
Table 11-3. Ranking by quality indicators for all reservoirs with<br />
five or more tournament reports in the 1994 B.A.LT.<br />
program . . . . . . . . . . . . . . . . . . . . . . . . . . . . . . . . . . . . . . . . . . . . . . . . . . . . . . . . . . . . .. 132<br />
Table 11-4. Ranking by quality indicators for all reservoirs with<br />
five or more tournament reports in the 1995 RA.LT.<br />
program. . . . . . . . . . . . . . . . . . . . . . . . . . . . . . . . . . . . . . . . . . . . . . . . . . . . . . . . . . . . .. 133<br />
Table 11-5. Checklist offish species collected from Smith Lake<br />
and the surrounding watershed ... . . . . . . . . . . . . . . . . . . . . . . . . . . . . . . . . . . . . . . . .. 134<br />
Table 11-6. Fish stockings in Lewis Smith Reservoir, 1980-1993 137<br />
XXI