LEWIS SMITH LAKE - Auburn University
LEWIS SMITH LAKE - Auburn University
LEWIS SMITH LAKE - Auburn University
Create successful ePaper yourself
Turn your PDF publications into a flip-book with our unique Google optimized e-Paper software.
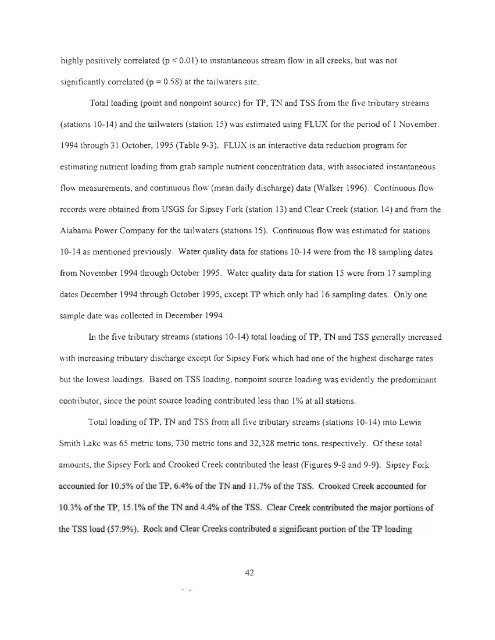
highly positively correlated (p < 0.01) to instantaneous stream flow in all creeks, but was not<br />
significantly correlated (p = 0.58) at the tailwaters site.<br />
Total loading (point and nonpoint source) for TP, TN and TSS from the five tributary streams<br />
(stations 10-14) and the tailwaters (station 15) was estimated using FLUX for the period of I November,<br />
1994 through 31 October, 1995 (Table 9-3). FLUX is an interactive data reduction program for<br />
estimating nutrient loading from grab sample nutrient concentration data, with associated instantaneous<br />
flow measurements, and continuous flow (mean daily discharge) data (Walker 1996). Continuous flow<br />
records were obtained from USGS for Sipsey Fork (station 13) and Clear Creek (station 14) and from the<br />
Alabama Power Company for the tailwaters (stations 15). Continuous flow was estimated for stations<br />
10-14 as mentioned previously. Water quality data for stations 10-14 were from the 18 sampling dates<br />
from November 1994 through October 1995. Water quality data for station 15 were from 17 sampling<br />
dates December 1994 through October 1995, except TP which only had 16 sampling dates. Only one<br />
sample date was collected in December 1994.<br />
In the five tributary streams (stations 10-14) total loading ofTP, TN and TSS generally increased<br />
with increasing tributary discharge except for Sipsey Fork which had one of the highest discharge rates<br />
but the lowest loadings. Based on TSS loading, nonpoint source loading was evidently the predominant<br />
contributor, since the point source loading contributed less than I% at all stations.<br />
Total loading ofTP, TN and TSS from all five tributary streams (stations 10-14) into Lewis<br />
Smith Lake was 65 metric tons, 730 metric tons and 32,328 metric tons, respectively. Ofthese total<br />
amounts, the Sipsey Fork and Crooked Creek contributed the least (Figures 9-8 and 9-9). Sipsey Fork<br />
accounted for 10.5% of the TP, 6.4% of the TN and 11.7% ofthe TSS. Crooked Creek accounted for<br />
10.3% of the TP, 15.1% of the TN and 4.4% of the TSS. Clear Creek contributed the major portions of<br />
the TSS load (57.9%). Rock and Clear Creeks contributed a significant portion ofthe TP loading<br />
42


