LEWIS SMITH LAKE - Auburn University
LEWIS SMITH LAKE - Auburn University
LEWIS SMITH LAKE - Auburn University

Create successful ePaper yourself
Turn your PDF publications into a flip-book with our unique Google optimized e-Paper software.
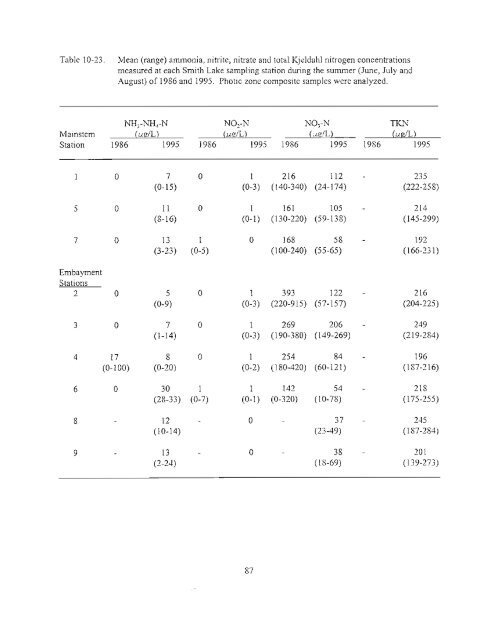
Table 10-23. Mean (range) ammonia, nitrite, nitrate and total Kjeldahl nitrogen concentrations<br />
measured at each Smith Lake sampling station during the summer (June, July and<br />
August) of 1986 and 1995. Photic zone composite samples were analyzed.<br />
Mainstem<br />
Station<br />
NH,-NH,-N<br />
(ul!/Ll<br />
1986 1995<br />
N0 2-N<br />
(ug/U<br />
1986 1995<br />
NO,-N<br />
(ug/Ll<br />
1986 1995<br />
TKN<br />
(ul!!Ll<br />
1986 1995<br />
0 7 0 1 216 112 235<br />
(0-15) (0-3) (140-340) (24-174) (222-258)<br />
5 0 11 0 1 161 105 214<br />
(8-16) (0-1) (130-220) (59-138) (145-299)<br />
7 0 13 I 0 168 58 192<br />
(3-23) (0-5) (100-240) (55-65) (166-231)<br />
Embayment<br />
Stations<br />
2 0 5 0 I 393 122 216<br />
(0-9) (0-3) (220-915) (57-157) (204-225)<br />
3 0 7 0 1 269 206 249<br />
(1-14) (0-3) (190-380) (149-269) (219-284)<br />
4 17 8 0 1 254 84 196<br />
(0-100) (0-20) (0-2) (180-420) (60-121) (187-216)<br />
6 0 30 I I 142 54 218<br />
(28-33) (0-7) (0-1) (0-320) (10-78) (175-255)<br />
8 12 0 37 245<br />
(10-14) (23-49) (187-284)<br />
9 13 0 38 201<br />
(2-24) (18-69) (139-273)<br />
87