Who earns minimum wages in Europe - European Trade Union ...
Who earns minimum wages in Europe - European Trade Union ...
Who earns minimum wages in Europe - European Trade Union ...

Create successful ePaper yourself
Turn your PDF publications into a flip-book with our unique Google optimized e-Paper software.
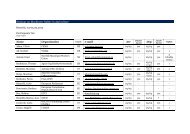
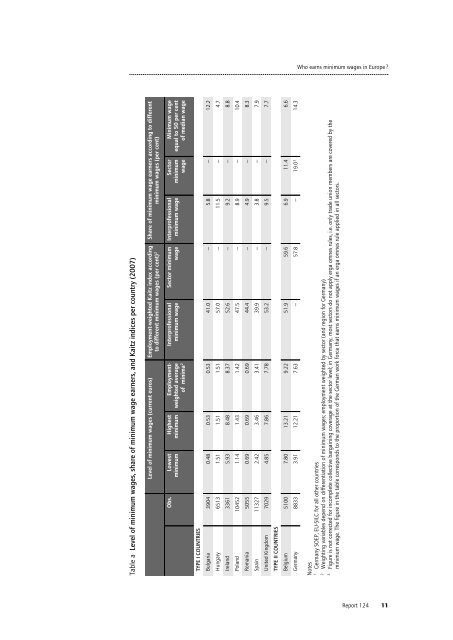
Table a Level of <strong>m<strong>in</strong>imum</strong> <strong>wages</strong>, share of <strong>m<strong>in</strong>imum</strong> wage earners, and Kaitz <strong>in</strong>dices per country (2007)<br />
Share of <strong>m<strong>in</strong>imum</strong> wage earners accord<strong>in</strong>g to different<br />
<strong>m<strong>in</strong>imum</strong> <strong>wages</strong> (per cent)<br />
Employment-weighted Kaitz <strong>in</strong>dex accord<strong>in</strong>g<br />
to different <strong>m<strong>in</strong>imum</strong> <strong>wages</strong> (per cent) 2<br />
Level of <strong>m<strong>in</strong>imum</strong> <strong>wages</strong> (current euros)<br />
M<strong>in</strong>imum wage<br />
equal to 50 per cent<br />
of median wage<br />
Sector<br />
<strong>m<strong>in</strong>imum</strong><br />
wage<br />
Interprofessional<br />
<strong>m<strong>in</strong>imum</strong> wage<br />
Sector <strong>m<strong>in</strong>imum</strong><br />
wage<br />
Interprofessional<br />
<strong>m<strong>in</strong>imum</strong> wage<br />
Employmentweighted<br />
average<br />
of m<strong>in</strong>ima2 Highest<br />
<strong>m<strong>in</strong>imum</strong><br />
Lowest<br />
<strong>m<strong>in</strong>imum</strong><br />
Obs.<br />
TYPE I COUNTRIES<br />
12.2<br />
4.7<br />
—<br />
—<br />
5.8<br />
—<br />
—<br />
41.0<br />
57.0<br />
0.53<br />
1.51<br />
0.53<br />
1.51<br />
0.48<br />
1.51<br />
3904<br />
6513<br />
Bulgaria<br />
Hungary<br />
8.8<br />
11.5<br />
9.2<br />
—<br />
—<br />
—<br />
—<br />
52.6<br />
47.5<br />
8.37<br />
1.42<br />
8.48<br />
1.43<br />
5.93<br />
1.14<br />
3361<br />
10.4<br />
8.3<br />
8.9<br />
4.9<br />
10452<br />
5055<br />
—<br />
—<br />
—<br />
—<br />
44.4<br />
39.9<br />
0.69<br />
3.41<br />
0.69<br />
3.46<br />
0.69<br />
2.42<br />
7.9<br />
7.7<br />
—<br />
3.8<br />
9.5<br />
—<br />
53.2<br />
7.78<br />
7.86<br />
4.85<br />
11327<br />
7029<br />
Ireland<br />
Poland<br />
Romania<br />
Spa<strong>in</strong><br />
United K<strong>in</strong>gdom<br />
TYPE II COUNTRIES<br />
6.6<br />
11.4<br />
14.3<br />
19.0 3<br />
6.9<br />
—<br />
59.6<br />
57.8<br />
51.9<br />
—<br />
9.22<br />
7.63<br />
13.21<br />
12.21<br />
7.80<br />
3.91<br />
5100<br />
8833<br />
Belgium<br />
Germany<br />
<strong>Who</strong> <strong>earns</strong> <strong>m<strong>in</strong>imum</strong> <strong>wages</strong> <strong>in</strong> <strong>Europe</strong> ?<br />
Notes<br />
1 Germany SOEP, EU-SILC for all other countries<br />
2 Weight<strong>in</strong>g variables depend on differentiation of <strong>m<strong>in</strong>imum</strong> <strong>wages</strong>; employment weighted by sector (and region for Germany)<br />
3 Figure is not corrected for <strong>in</strong>complete collective barga<strong>in</strong><strong>in</strong>g coverage at the sector level; <strong>in</strong> Germany, most sectors do not apply erga omnes rules, i.e. only trade union members are covered by the<br />
<strong>m<strong>in</strong>imum</strong> wage. The figure <strong>in</strong> the table corresponds to the proportion of the German work force that <strong>earns</strong> <strong>m<strong>in</strong>imum</strong> <strong>wages</strong> if an erga omnes rule applied <strong>in</strong> all sectors.<br />
Report 124<br />
11