National Strategic Reference Framework
National Strategic Reference Framework
National Strategic Reference Framework

You also want an ePaper? Increase the reach of your titles
YUMPU automatically turns print PDFs into web optimized ePapers that Google loves.
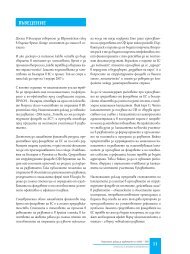
MALTA – <strong>National</strong> <strong>Strategic</strong> <strong>Reference</strong> <strong>Framework</strong> 2007-2013 Draft Document for Consultation<br />
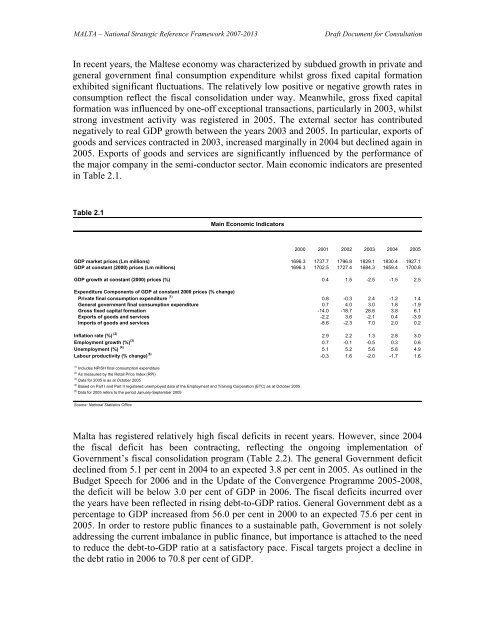
In recent years, the Maltese economy was characterized by subdued growth in private and<br />
general government final consumption expenditure whilst gross fixed capital formation<br />
exhibited significant fluctuations. The relatively low positive or negative growth rates in<br />
consumption reflect the fiscal consolidation under way. Meanwhile, gross fixed capital<br />
formation was influenced by one-off exceptional transactions, particularly in 2003, whilst<br />
strong investment activity was registered in 2005. The external sector has contributed<br />
negatively to real GDP growth between the years 2003 and 2005. In particular, exports of<br />
goods and services contracted in 2003, increased marginally in 2004 but declined again in<br />
2005. Exports of goods and services are significantly influenced by the performance of<br />
the major company in the semi-conductor sector. Main economic indicators are presented<br />
in Table 2.1.<br />
Table 2.1<br />
2000 2001 2002 2003 2004 2005<br />
GDP market prices (Lm millions) 1696.3 1737.7 1796.8 1829.1 1830.4 1927.1<br />
GDP at constant (2000) prices (Lm millions) 1696.3 1702.5 1727.4 1684.3 1659.4 1700.8<br />
GDP growth at constant (2000) prices (%) 0.4 1.5 -2.5 -1.5 2.5<br />
Expenditure Components of GDP at constant 2000 prices (% change)<br />
Private final consumption expenditure (1)<br />
0.8 -0.3 2.4 -1.2 1.4<br />
General government final consumption expenditure 0.7 4.0 3.0 1.8 -1.9<br />
Gross fixed capital formation -14.0 -18.7 28.6 3.8 6.1<br />
Exports of goods and services -2.2 3.6 -2.1 0.4 -3.9<br />
Imports of goods and services -8.6 -2.3 7.0 2.0 0.2<br />
Inflation rate (%) (2)<br />
Employment growth (%) (3)<br />
Unemployment (%) (4)<br />
Labour productivity (% change) (5)<br />
(1)<br />
Includes NPISH final consumption expenditure<br />
(2)<br />
As measured by the Retail Price Index (RPI)<br />
(3)<br />
Data for 2005 is as at October 2005<br />
(4)<br />
Based on Part I and Part II registered unemployed data of the Employment and Training Corporation (ETC) as at October 2005<br />
(5) Data for 2005 refers to the period January-September 2005<br />
Source: <strong>National</strong> Statistics Office<br />
Main Economic Indicators<br />
2.9 2.2 1.3 2.8 3.0<br />
0.7 -0.1 -0.5 0.3 0.6<br />
5.1 5.2 5.6 5.6 4.9<br />
-0.3 1.6 -2.0 -1.7 1.6<br />
Malta has registered relatively high fiscal deficits in recent years. However, since 2004<br />
the fiscal deficit has been contracting, reflecting the ongoing implementation of<br />
Government’s fiscal consolidation program (Table 2.2). The general Government deficit<br />
declined from 5.1 per cent in 2004 to an expected 3.8 per cent in 2005. As outlined in the<br />
Budget Speech for 2006 and in the Update of the Convergence Programme 2005-2008,<br />
the deficit will be below 3.0 per cent of GDP in 2006. The fiscal deficits incurred over<br />
the years have been reflected in rising debt-to-GDP ratios. General Government debt as a<br />
percentage to GDP increased from 56.0 per cent in 2000 to an expected 75.6 per cent in<br />
2005. In order to restore public finances to a sustainable path, Government is not solely<br />
addressing the current imbalance in public finance, but importance is attached to the need<br />
to reduce the debt-to-GDP ratio at a satisfactory pace. Fiscal targets project a decline in<br />
the debt ratio in 2006 to 70.8 per cent of GDP.