National Strategic Reference Framework
National Strategic Reference Framework
National Strategic Reference Framework

Create successful ePaper yourself
Turn your PDF publications into a flip-book with our unique Google optimized e-Paper software.
MALTA – <strong>National</strong> <strong>Strategic</strong> <strong>Reference</strong> <strong>Framework</strong> 2007-2013 Draft Document for Consultation<br />
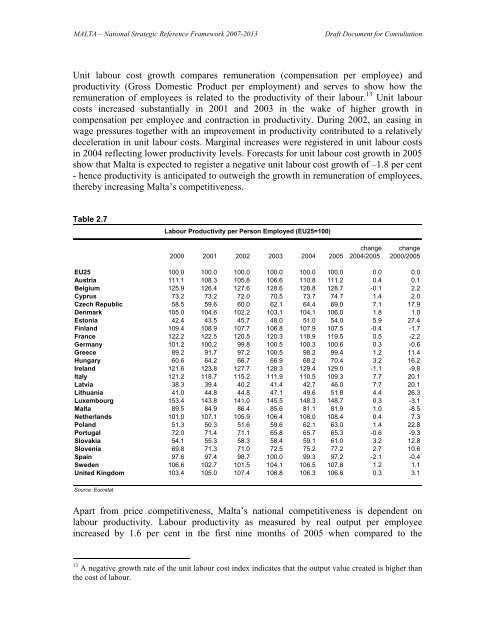
Unit labour cost growth compares remuneration (compensation per employee) and<br />
productivity (Gross Domestic Product per employment) and serves to show how the<br />
remuneration of employees is related to the productivity of their labour. 13 Unit labour<br />
costs increased substantially in 2001 and 2003 in the wake of higher growth in<br />
compensation per employee and contraction in productivity. During 2002, an easing in<br />
wage pressures together with an improvement in productivity contributed to a relatively<br />
deceleration in unit labour costs. Marginal increases were registered in unit labour costs<br />
in 2004 reflecting lower productivity levels. Forecasts for unit labour cost growth in 2005<br />
show that Malta is expected to register a negative unit labour cost growth of –1.8 per cent<br />
- hence productivity is anticipated to outweigh the growth in remuneration of employees,<br />
thereby increasing Malta’s competitiveness.<br />
Table 2.7<br />
change change<br />
2000 2001 2002 2003 2004 2005 2004/2005 2000/2005<br />
EU25 100.0 100.0 100.0 100.0 100.0 100.0 0.0 0.0<br />
Austria 111.1 108.3 105.8 106.6 110.8 111.2 0.4 0.1<br />
Belgium 125.9 126.4 127.6 128.6 128.8 128.7 -0.1 2.2<br />
Cyprus 73.2 73.2 72.0 70.5 73.7 74.7 1.4 2.0<br />
Czech Republic 58.5 59.6 60.0 62.1 64.4 69.0 7.1 17.9<br />
Denmark 105.0 104.6 102.2 103.1 104.1 106.0 1.8 1.0<br />
Estonia 42.4 43.5 45.7 48.0 51.0 54.0 5.9 27.4<br />
Finland 109.4 108.9 107.7 106.8 107.9 107.5 -0.4 -1.7<br />
France 122.2 122.5 120.5 120.3 118.9 119.5 0.5 -2.2<br />
Germany 101.2 100.2 99.8 100.5 100.3 100.6 0.3 -0.6<br />
Greece 89.2 91.7 97.2 100.5 98.2 99.4 1.2 11.4<br />
Hungary 60.6 64.2 66.7 66.9 68.2 70.4 3.2 16.2<br />
Ireland 121.6 123.8 127.7 128.3 129.4 129.0 -1.1 -9.8<br />
Italy 121.2 118.7 115.2 111.9 110.5 109.3 7.7 20.1<br />
Latvia 38.3 39.4 40.2 41.4 42.7 46.0 7.7 20.1<br />
Lithuania 41.0 44.8 44.8 47.1 49.6 51.8 4.4 26.3<br />
Luxembourg 153.4 143.8 141.0 145.5 148.3 148.7 0.3 -3.1<br />
Malta 89.5 84.9 86.4 85.6 81.1 81.9 1.0 -8.5<br />
Netherlands 101.0 107.1 105.9 106.4 108.0 108.4 0.4 7.3<br />
Poland 51.3 50.3 51.6 59.6 62.1 63.0 1.4 22.8<br />
Portugal 72.0 71.4 71.1 65.8 65.7 65.3 -0.6 -9.3<br />
Slovakia 54.1 55.3 58.3 58.4 59.1 61.0 3.2 12.8<br />
Slovenia 69.8 71.3 71.0 72.5 75.2 77.2 2.7 10.6<br />
Spain 97.6 97.4 98.7 100.0 99.3 97.2 -2.1 -0.4<br />
Sweden 106.6 102.7 101.5 104.1 106.5 107.8 1.2 1.1<br />
United Kingdom 103.4 105.0 107.4 106.8 106.3 106.6 0.3 3.1<br />
Source: Eurostat<br />
Labour Productivity per Person Employed (EU25=100)<br />
Apart from price competitiveness, Malta’s national competitiveness is dependent on<br />
labour productivity. Labour productivity as measured by real output per employee<br />
increased by 1.6 per cent in the first nine months of 2005 when compared to the<br />
13 A negative growth rate of the unit labour cost index indicates that the output value created is higher than<br />
the cost of labour.