National Strategic Reference Framework
National Strategic Reference Framework
National Strategic Reference Framework

Create successful ePaper yourself
Turn your PDF publications into a flip-book with our unique Google optimized e-Paper software.
MALTA – <strong>National</strong> <strong>Strategic</strong> <strong>Reference</strong> <strong>Framework</strong> 2007-2013 Draft Document for Consultation<br />
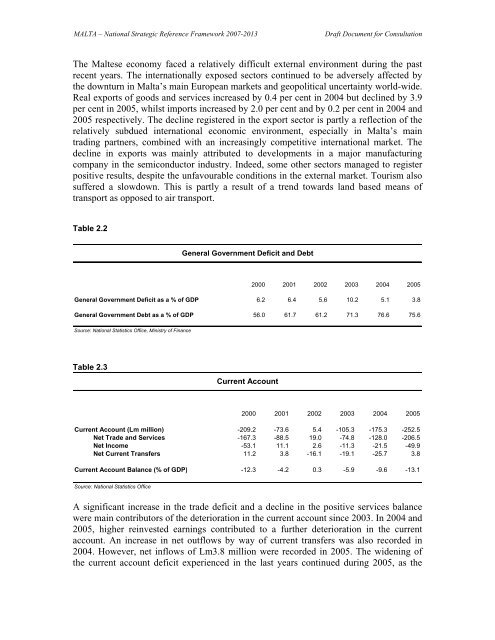
The Maltese economy faced a relatively difficult external environment during the past<br />
recent years. The internationally exposed sectors continued to be adversely affected by<br />
the downturn in Malta’s main European markets and geopolitical uncertainty world-wide.<br />
Real exports of goods and services increased by 0.4 per cent in 2004 but declined by 3.9<br />
per cent in 2005, whilst imports increased by 2.0 per cent and by 0.2 per cent in 2004 and<br />
2005 respectively. The decline registered in the export sector is partly a reflection of the<br />
relatively subdued international economic environment, especially in Malta’s main<br />
trading partners, combined with an increasingly competitive international market. The<br />
decline in exports was mainly attributed to developments in a major manufacturing<br />
company in the semiconductor industry. Indeed, some other sectors managed to register<br />
positive results, despite the unfavourable conditions in the external market. Tourism also<br />
suffered a slowdown. This is partly a result of a trend towards land based means of<br />
transport as opposed to air transport.<br />
Table 2.2<br />
2000 2001 2002 2003 2004 2005<br />
General Government Deficit as a % of GDP 6.2 6.4 5.6 10.2 5.1 3.8<br />
General Government Debt as a % of GDP 56.0 61.7 61.2 71.3 76.6 75.6<br />
Source: <strong>National</strong> Statistics Office, Ministry of Finance<br />
Table 2.3<br />
General Government Deficit and Debt<br />
2000 2001 2002 2003 2004 2005<br />
Current Account (Lm million) -209.2 -73.6 5.4 -105.3 -175.3 -252.5<br />
Net Trade and Services -167.3 -88.5 19.0 -74.8 -128.0 -206.5<br />
Net Income -53.1 11.1 2.6 -11.3 -21.5 -49.9<br />
Net Current Transfers 11.2 3.8 -16.1 -19.1 -25.7 3.8<br />
Current Account Balance (% of GDP) -12.3 -4.2 0.3 -5.9 -9.6 -13.1<br />
Source: <strong>National</strong> Statistics Office<br />
Current Account<br />
A significant increase in the trade deficit and a decline in the positive services balance<br />
were main contributors of the deterioration in the current account since 2003. In 2004 and<br />
2005, higher reinvested earnings contributed to a further deterioration in the current<br />
account. An increase in net outflows by way of current transfers was also recorded in<br />
2004. However, net inflows of Lm3.8 million were recorded in 2005. The widening of<br />
the current account deficit experienced in the last years continued during 2005, as the