National Strategic Reference Framework
National Strategic Reference Framework
National Strategic Reference Framework

Create successful ePaper yourself
Turn your PDF publications into a flip-book with our unique Google optimized e-Paper software.
MALTA – <strong>National</strong> <strong>Strategic</strong> <strong>Reference</strong> <strong>Framework</strong> 2007-2013 Draft Document for Consultation<br />
EU 25 Malta<br />
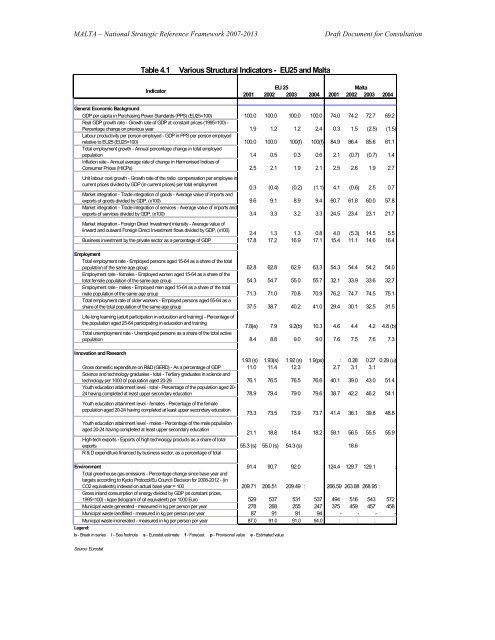
2001 2002 2003 2004 2001 2002 2003 2004<br />
General Economic Background<br />
GDP per capita in Purchasing Power Standards (PPS) (EU25=100) 100.0 100.0 100.0 100.0 74.0 74.2 72.7 69.2<br />
Real GDP growth rate - Growth rate of GDP at constant prices (1995=100) -<br />
Percentage change on previous year 1.9 1.2 1.2 2.4 0.3 1.5 (2.5) (1.5)<br />
Labour productivity per person employed - GDP in PPS per person employed<br />
relative to EU25 (EU25=100) 100.0 100.0 100(f) 100(f) 84.9 86.4 85.6 81.1<br />
Total employment growth - Annual percentage change in total employed<br />
population 1.4 0.5 0.3 0.6 2.1 (0.7) (0.7) 1.4<br />
Inflation rate - Annual average rate of change in Harmonised Indices of<br />
Consumer Prices (HICPs) 2.5 2.1 1.9 2.1 2.5 2.6 1.9 2.7<br />
Unit labour cost growth - Growth rate of the ratio: compensation per employee in<br />
current prices divided by GDP (in current prices) per total employment<br />
0.3 (0.4) (0.2) (1.1) 4.1 (0.6) 2.5 0.7<br />
Market integration - Trade integration of goods - Average value of imports and<br />
exports of goods divided by GDP, (x100) 9.6 9.1 8.9 9.4 60.7 61.8 60.0 57.8<br />
Market integration - Trade integration of services - Average value of imports and<br />
exports of services divided by GDP, (x100) 3.4 3.3 3.2 3.3 24.5 23.4 23.1 21.7<br />
Market integration - Foreign Direct Investment intensity - Average value of<br />
iinward and outward Foreign Direct Investment flows divided by GDP, (x100)<br />
2.4 1.3 1.3 0.8 4.0 (5.3) 14.5 5.5<br />
Business investment by the private sector as a percentage of GDP 17.8 17.2 16.9 17.1 15.4 11.1 14.6 16.4<br />
Employment<br />
Total employment rate - Employed persons aged 15-64 as a share of the total<br />
population of the same age group 62.8 62.8 62.9 63.3 54.3 54.4 54.2 54.0<br />
Employment rate - females - Employed women aged 15-64 as a share of the<br />
total female population of the same age group 54.3 54.7 55.0 55.7 32.1 33.9 33.6 32.7<br />
Employment rate - males - Employed men aged 15-64 as a share of the total<br />
male population of the same age group 71.3 71.0 70.8 70.9 76.2 74.7 74.5 75.1<br />
Total employment rate of older workers - Employed persons aged 55-64 as a<br />
share of the total population of the same age group 37.5 38.7 40.2 41.0 29.4 30.1 32.5 31.5<br />
Life-long learning (adult participation in education and training) - Percentage of<br />
the population aged 25-64 participating in education and training<br />
7.8(e) 7.9 9.2(b) 10.3 4.6 4.4 4.2 4.8 (b)<br />
Total unemployment rate - Unemployed persons as a share of the total active<br />
population 8.4 8.8 9.0 9.0 7.6 7.5 7.6 7.3<br />
Innovation and Research<br />
1.93 (s) 1.93(s) 1.92 (s) 1.9(ps) : 0.28 0.27 0.29 (u)<br />
Gross domestic expenditure on R&D (GERD) - As a percentage of GDP<br />
Science and technology graduates - total - Tertiary graduates in science and<br />
11.0 11.4 12.3 : 2.7 3.1 3.1 :<br />
technology per 1000 of population aged 20-29<br />
Youth education attainment level - total - Percentage of the population aged 20-<br />
76.1 76.5 76.5 76.6 40.1 39.0 43.0 51.4<br />
24 having completed at least upper secondary education 78.9 79.4 79.0 79.6 38.7 42.2 46.2 54.1<br />
Youth education attainment level - females - Percentage of the female<br />
population aged 20-24 having completed at least upper secondary education<br />
Youth education attainment level - males - Percentage of the male population<br />
aged 20-24 having completed at least upper secondary education<br />
73.3 73.5 73.9 73.7 41.4 36.1 39.8 48.8<br />
21.1 18.8 18.4 18.2 58.1 56.5 55.5 55.9<br />
High-tech exports - Exports of high technology products as a share of total<br />
exports 55.3 (s) 55.0 (s) 54.3 (s) 18.6<br />
R & D expenditure financed by business sector, as a percentage of total<br />
Environment<br />
Total greenhouse gas emissions - Percentage change since base year and<br />
targets according to Kyoto Protocol/Eu Council Decision for 2008-2012 - (in<br />
91.4 90.7 92.0 : 124.4 129.7 129.1 :<br />
CO2 equivalents) indexed on actual base year = 100<br />
Gross inland consumption of energy divided by GDP (at constant prices,<br />
209.71 206.51 209.49 : 266.59 263.88 268.95 :<br />
1995=100) - kgoe (kilogram of oil equivalent) per 1000 Euro 529 537 531 537 494 516 543 572<br />
Municipal waste generated - measured in kg per person per year 278 268 255 247 375 459 457 458<br />
Municipal waste landfilled - measured in kg per person per year 87 91 91 94 - - - -<br />
Municpal waste incinerated - measured in kg per person per year 87.0 91.0 91.0 94.0 : : : :<br />
Legend:<br />
b - Break in series i - See footnote s - Eurostat estimate f - Forecast p - Provisional value e - Estimated value<br />
Source: Eurostat<br />
Table 4.1 Various Structural Indicators - EU25 and Malta<br />
Indicator