Jefferson County - East-West Gateway Coordinating Council
Jefferson County - East-West Gateway Coordinating Council
Jefferson County - East-West Gateway Coordinating Council

Create successful ePaper yourself
Turn your PDF publications into a flip-book with our unique Google optimized e-Paper software.
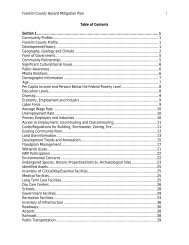
A Regional Overview All-Hazard Mitigation Plan 83<br />
food processing (reduced irrigation water led to a reduction in vegetable production, with<br />
concomitant losses in jobs and income).<br />
There are no official estimates of the total losses and damages from the 1996 drought.<br />
Given the $5 billion in impacts that occurred in Texas, total regional impacts could be<br />
safely estimated in the $10–15 billion range, although it is difficult to quantify many social<br />
and environmental impacts. What was remarkable to many was the significant level of<br />
regional vulnerability, the diversity of impacts, and the lack of preparedness to respond to<br />
many of these impacts. Many of the states in this region have now initiated longer-term<br />
planning efforts directed at improving mitigation and preparedness<br />
Hazard Event History<br />
Some of the worst droughts on record to affect Region 2 occurred in 1901-02, 1913-14,<br />
1930-31, 1934, 1936, 1940-41, 1953-56, 1963-64, 1980-81, 1988-89 and 1999-2000.<br />
The 1953-56 drought is considered to be the worst on record for Region 2.<br />
Droughts on record to affect Region 5 occurred in 1900-09, 1940-49, 1950-59, 1964-66<br />
and 1980. The drought from 1954-56 was the worst on record for Region 5. Table J44<br />
below shows the Big River level stage during drought conditions.<br />
TABLE J44 RIVER LEVEL STAGES IN DROUGHT CONDITIONS IN JEFFERSON<br />
COUNTY<br />
Station Stage (Flood Stage 16 ft) Date<br />
Big River at Byrnes Mill 1.5 8/30/1936<br />
1.5 9/13/2000<br />
1.4 10/05/2001<br />
An overall excellent drought resource on the Internet is the National Drought Mitigation<br />
Center (NDMC). The NDMC provides historical drought information for the U.S. from 1895<br />
through current. Linking to the following address will provide drought information:<br />
http://www.drought.unl.edu/whatis/what.htm<br />
Table J45 identifies, using the Palmer Drought Severity Index, the monthly average for the<br />
period of record for the study area.<br />
TABLE J45 PALMER DROUGHT SEVERITY INDEX MONTHLY<br />
AVERAGE FOR PERIOD OF RECORD<br />
1895 TO 1995<br />
Month Division 2 Division 5<br />
January -0.06 -0.04<br />
February -0.42 -0.94<br />
March -0.66 -1.16<br />
April -0.99 -1.70<br />
May -1.23 -1.62