Urban Climate News - FAU
Urban Climate News - FAU
Urban Climate News - FAU

Create successful ePaper yourself
Turn your PDF publications into a flip-book with our unique Google optimized e-Paper software.
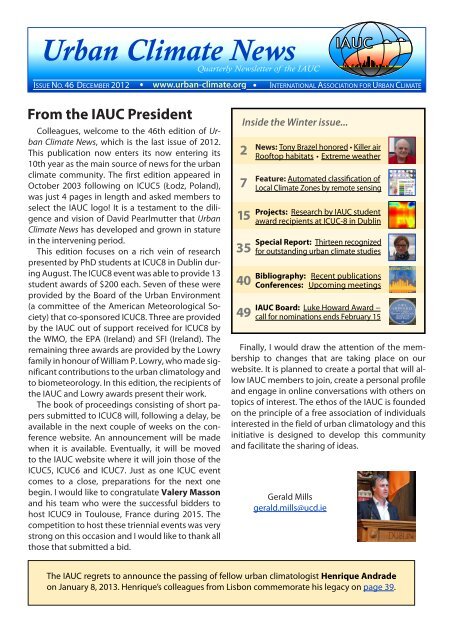
<strong>Urban</strong> <strong>Climate</strong> <strong>News</strong><br />
Quarterly <strong>News</strong>letter of the IAUC<br />
ISSUE NO. 46 DECEMBER 2012 • INTERNATIONAL ASSOCIATION FOR URBAN CLIMATE<br />
From the IAUC President<br />
Colleagues, welcome to the 46th edition of <strong>Urban</strong><br />
<strong>Climate</strong> <strong>News</strong>, which is the last issue of 2012.<br />
This publication now enters its now entering its<br />
10th year as the main source of news for the urban<br />
climate community. The first edition appeared in<br />
October 2003 following on ICUC5 (Łodz, Poland),<br />
was just 4 pages in length and asked members to<br />
select the IAUC logo! It is a testament to the diligence<br />
and vision of David Pearlmutter that <strong>Urban</strong><br />
<strong>Climate</strong> <strong>News</strong> has developed and grown in stature<br />
in the intervening period.<br />
This edition focuses on a rich vein of research<br />
presented by PhD students at ICUC8 in Dublin during<br />
August. The ICUC8 event was able to provide 13<br />
student awards of $200 each. Seven of these were<br />
provided by the Board of the <strong>Urban</strong> Environment<br />
(a committee of the American Meteorological Society)<br />
that co-sponsored ICUC8. Three are provided<br />
by the IAUC out of support received for ICUC8 by<br />
the WMO, the EPA (Ireland) and SFI (Ireland). The<br />
remaining three awards are provided by the Lowry<br />
family in honour of William P. Lowry, who made significant<br />
contributions to the urban climatology and<br />
to biometeorology. In this edition, the recipients of<br />
the IAUC and Lowry awards present their work.<br />
The book of proceedings consisting of short papers<br />
submitted to ICUC8 will, following a delay, be<br />
available in the next couple of weeks on the conference<br />
website. An announcement will be made<br />
when it is available. Eventually, it will be moved<br />
to the IAUC website where it will join those of the<br />
ICUC5, ICUC6 and ICUC7. Just as one ICUC event<br />
comes to a close, preparations for the next one<br />
begin. I would like to congratulate Valery Masson<br />
and his team who were the successful bidders to<br />
host ICUC9 in Toulouse, France during 2015. The<br />
competition to host these triennial events was very<br />
strong on this occasion and I would like to thank all<br />
those that submitted a bid.<br />
Inside the Winter issue...<br />
2<br />
7<br />
15<br />
35<br />
40<br />
49<br />
<strong>News</strong>: Tony Brazel honored • Killer air<br />
Rooftop habitats • Extreme weather<br />
Feature: Automated classification of<br />
Local <strong>Climate</strong> Zones by remote sensing<br />
Projects: Research by IAUC student<br />
award recipients at ICUC-8 in Dublin<br />
Special Report: Thirteen recognized<br />
for outstanding urban climate studies<br />
Bibliography: Recent publications<br />
Conferences: Upcoming meetings<br />
IAUC Board: Luke Howard Award −<br />
call for nominations ends February 15<br />
Finally, I would draw the attention of the membership<br />
to changes that are taking place on our<br />
website. It is planned to create a portal that will allow<br />
IAUC members to join, create a personal profile<br />
and engage in online conversations with others on<br />
topics of interest. The ethos of the IAUC is founded<br />
on the principle of a free association of individuals<br />
interested in the field of urban climatology and this<br />
initiative is designed to develop this community<br />
and facilitate the sharing of ideas.<br />
Gerald Mills<br />
gerald.mills@ucd.ie<br />
The IAUC regrets to announce the passing of fellow urban climatologist Henrique Andrade<br />
on January 8, 2013. Henrique’s colleagues from Lisbon commemorate his legacy on page 39.
In the <strong>News</strong> 2<br />
Tony Brazel honored for four decades of seminal research<br />
in urban climatology<br />
October 2012 — Anthony J. Brazel, Arizona State University<br />
professor emeritus, has received the Helmet E.<br />
Landsberg Award for 2013 from the American Meteorological<br />
Society’s Board on the <strong>Urban</strong> Environment.<br />
“Tony’s recognition by the American Meteorological<br />
Society highlights the prominent recognition his work<br />
has garnered across a spectrum of geophysical disciplines,”<br />
said Randall Cerveny, ASU President’s Professor<br />
and climatologist in the School of Geographical Sciences<br />
and <strong>Urban</strong> Planning. “His research papers, with topics<br />
that include everything from Phoenix urban dust storms<br />
to the intricacies of urban climate energy fluxes, are<br />
some of the most highly regarded works by geographical<br />
climatologists.”<br />
This award is named after Helmut E. Landsberg, a climatologist<br />
and Presidential Medal of Science winner<br />
who modernized how climate data are used to help<br />
solve societal problems. Among other accomplishments,<br />
Landsberg made ground-breaking connections<br />
between climate and urbanization by helping advance<br />
the study of urban climates from a descriptive study to<br />
one of physical understanding. In selecting Brazel for the<br />
award, the society noted the ASU professor’s “fundamental<br />
contributions to the field of urban climatology, especially<br />
those related to understanding urban heat islands<br />
in desert environments.”<br />
Brazel’s work in desert urban climatology began soon<br />
after he became director of ASU’s Laboratory of Climatology<br />
and governor-designated Arizona State Climatologist<br />
in 1979. “With new realizations of climate change<br />
at this time, there arose many applied and fundamental<br />
research opportunities for colleagues at ASU to investigate<br />
the role of urbanization and climate change” said<br />
Brazel. “The ‘research laboratory’ was right in front of us<br />
– Phoenix, Ariz.”<br />
As state climatologist, a position he held until 1999,<br />
Brazel and his colleagues worked closely with stakeholders<br />
ranging from the National Weather Service to<br />
the Arizona Department of Environmental Quality, water<br />
and energy provider Salt River Project (SRP), and city<br />
and county organizations. In the 1980’s, Brazel helped<br />
establish a partnership between SRP, ASU, and the State<br />
<strong>Climate</strong> Office that focused on improving short-term<br />
weather forecasting models applied to urban areas.<br />
Collaborations such as these catalyzed urban climate<br />
research, rooted in Phoenix-area and Arizona climate issues,<br />
but with implications for the understanding of urban<br />
climate globally.<br />
Beginning in the late 1990s, as part of the National<br />
Science Foundation-funded Central Arizona-Phoenix<br />
Brazel was recognized for his“fundamental contributions<br />
to the field of urban climatology.” Photo: ASU<br />
Long-Term Ecological Research (CAPLTER) Project, Brazel<br />
fostered the interdisciplinary study of the region’s<br />
urban climate, not only leading research initiatives but<br />
also mentoring fellow faculty, postdoctoral and graduate<br />
student researchers.<br />
“A simple literature search shows nearly twice as many<br />
peer-reviewed research articles dealing with Phoenix’s<br />
urban heat island as there are for either New York City<br />
or Houston,” comments Winston Chow, a research fellow<br />
in ASU’s Department of Engineering, College of Technology<br />
and Innovation, with a concurrent appointment in<br />
the National University of Singapore’s Department of<br />
Geography. “This flourishing of research in Phoenix is in<br />
large part due to Brazel’s success in advancing partnerships<br />
between ASU and local stakeholders.”<br />
“Another important aspect of his work,” Chow adds,<br />
“is his dedication to geographical fieldwork. Tony has<br />
trained numerous students to value the importance of<br />
its proper practice, which is key to excellent research.”<br />
”Brazel’s work in urban climatology – particularly in<br />
desert urban climatology – over the last four decades<br />
has, quite literally, shaped the fundamental concepts<br />
and themes for current research into this increasingly<br />
vital and important scientific and social topic,” observes<br />
Luc Anselin, Regents’ Professor and School of Geographical<br />
Sciences director.<br />
Brazel is an emeritus professor in the School of Geographical<br />
Sciences and <strong>Urban</strong> Planning, an academic<br />
unit of the College of Liberal Arts and Sciences. In 2010,<br />
he received the Association of American Geographers<br />
<strong>Climate</strong> Specialty Group Lifetime Achievement Award.<br />
Brazel remains as a senior sustainability scholar with<br />
ASU’s Global Institute of Sustainability, is editor of the<br />
Journal of the Arizona-Nevada Academy of Science, and<br />
serves on the Editorial Board of the Annals of the Association<br />
of American Geographers.<br />
Brazel received the Landsberg Award at the AMS national<br />
meeting, held in Austin, Texas on January 6-10, 2013.<br />
Source: https://asunews.asu.edu/20121015_brazel_award<br />
ISSUE NO. 46 DECEMBER 2012 INTERNATIONAL ASSOCIATION FOR URBAN CLIMATE
In the <strong>News</strong> 3<br />
Unbreathable: Air Pollution Becomes a Major Global Killer<br />
December 2012 — The economic growth that many<br />
nations in Asia and increasingly Africa have experienced<br />
over the past couple of decades has transformed hundreds<br />
of millions of lives − almost entirely for the better.<br />
But there’s a byproduct to that growth, one that’s visible<br />
− or sometimes less than visible − in the smoggy, smelly<br />
skies above cities like Beijing, New Delhi and Jakarta.<br />
Thanks to new cars and power plants, air pollution is bad<br />
and getting worse in much of the world, and it’s taking a<br />
major toll on global health.<br />
How big? According to a new analysis published in the<br />
Lancet, more than 3.2 million people suffered premature<br />
deaths from air pollution in 2010, the largest number on<br />
record. That’s up from 800,000 in 2000. And it’s a regional<br />
problem: 65% of those deaths occurred in Asia, where<br />
the air is choked by diesel soot from cars and trucks, as<br />
well as the smog from power plants and the dust from<br />
endless urban construction. In East Asia and China, 1.2<br />
million people died, as well as another 712,000 in South<br />
Asia, including India. For the first time ever, air pollution<br />
is on the world’s top-10 list of killers, and it’s moving up<br />
the ranks faster than any other factor.<br />
David Pettit of the Natural Resources Defense Council<br />
explains why air pollution can be so deadly:<br />
“So how can air pollution be so damaging? It is the<br />
very finest soot − so small that it lodges deep within<br />
the lungs and from there enters the bloodstream −<br />
that contributes to most of the public-health toll of<br />
air pollution including mortality. Diesel soot, which<br />
is also a carcinogen, is a major problem because it is<br />
concentrated in cities along transportation corridors<br />
impacting densely populated areas. It is thought to<br />
contribute to half the premature deaths from air pollution<br />
in urban centers. For example, 1 in 6 people in<br />
the U.S. live near a diesel-pollution hot spot like a rail<br />
yard, port terminal or freeway.”<br />
We also know that air pollution may be linked to other<br />
nonlethal conditions, including autism. Fortunately in<br />
the U.S. and other developed nations, urban air is for the<br />
most part cleaner than it was 30 or 40 years ago, thanks<br />
to regulations and new technologies like the catalytic<br />
China to release real-time air quality data — The Chinese Ministry of Environmental<br />
Protection reported in December that the government would<br />
issue real-time air quality monitoring data in 74 cities starting Jan. 1, 2013.<br />
Notably, the data are to include PM2.5, whereas information on particulate<br />
matter available in China used to be limited to PM10. A chief ministry engineer<br />
said data on major pollutants in the air, namely sulfur dioxide, nitrogen<br />
dioxide, ozone, carbon monoxide and particulate matter will be collected<br />
via 496 monitoring sites and released on an hourly basis. Source: Xinhua<br />
A smoggy day in New Delhi, Nov. 2012. Photo: TIME<br />
converters that reduce automobile emissions. Governments<br />
are also pushing to make air cleaner − see the<br />
White House’s move last week to further tighten soot<br />
standards. It’s not perfect, but we’ve had much more success<br />
dealing with air pollution than climate change.<br />
Will developing nations like China and India eventually<br />
catch up? Hopefully − though the problem may get worse<br />
before it gets better. The good news is that it doesn’t take<br />
a major technological leap to improve urban air. Switching<br />
from diesel fuel to unleaded helps, as do newer and<br />
cleaner cars that are less likely to spew pollutants. Power<br />
plants − even ones that burn fossil fuels like coal − can be<br />
fitted with pollution-control equipment that, at a price,<br />
will greatly reduce smog and other contaminants.<br />
But the best solutions may involve urban design. In<br />
the Guardian, John Vidal notes that Delhi now has 200<br />
cars per 1,000 people, far more than much richer Asian<br />
cities like Hong Kong and Singapore. Developing cities<br />
will almost certainly see an increase in car ownership as<br />
residents become wealthier — and that doesn’t have to<br />
mean lethal air pollution. (Even ultra-green European<br />
cities often have rates of car ownership at or above the<br />
level Delhi has now.) Higher incomes should also lead<br />
to tougher environmental regulations, which is exactly<br />
what happened in the West. We can only hope it happens<br />
before the death toll from bad air gets even higher.<br />
Source: http://science.time.com/2012/12/20/unbreathable-air-pollution-becomes-a-major-global-killer/<br />
ISSUE NO. 46 DECEMBER 2012 INTERNATIONAL ASSOCIATION FOR URBAN CLIMATE
In the <strong>News</strong> 4<br />
Turning Israeli roofs into green habitats<br />
The new Green Roofs Ecology Center in Haifa<br />
is the first of its kind in the Middle East − and one of the<br />
first globally to focus on biodiversity<br />
December 2012 — Anybody can plunk down some<br />
potted trees and pretty planters on a roof, but a rooftop<br />
garden does not offer the same environmental and ecological<br />
benefits as a “green roof” – a layer of low-maintenance<br />
vegetation that insulates the building underneath<br />
and reduces flash flooding on paved streets below by<br />
acting as a sponge for rainfall.<br />
Prof. Leon Blaustein, director of the University of Haifa’s<br />
new Green Roofs Ecology Center, says the Israeli center<br />
is the first of its kind in the Middle East and one of the<br />
first worldwide to focus specifically on how to conserve<br />
biodiversity in an urban setting.<br />
“When you create a city, you’re destroying much of<br />
the natural habitat for plants and animals, and we want<br />
to mitigate this as much as possible with our rooftop<br />
habitats,” Blaustein says.<br />
Blaustein and his team have installed 48 experimental<br />
modules on top of the university’s Student Union, each<br />
with a different growing material, drainage configuration<br />
and plant grouping.<br />
Ecology researchers around the world will be watching<br />
as the Israelis monitor how well each of the modules<br />
thrives and attracts insects, birds and other fauna, in the<br />
hope of determining the most successful recipe for developing<br />
biodiverse green roofs in arid climates.<br />
Eventually, they hope to create experimental green<br />
roof plots on additional buildings on the campus and<br />
around the city of Haifa, as well as other Israeli cities.<br />
Rooftop ‘playground’ for ecologists<br />
The Green Roofs Ecology Center will provide an unusual<br />
outdoor laboratory for ecology and evolutionary<br />
Photo: Israel21c<br />
biology researchers from around the world to develop<br />
and test ecological theories, says Blaustein, who heads<br />
the university’s Community Ecology Laboratory.<br />
“We’re just getting started. We are looking for collaborators<br />
outside the university, such as government<br />
and NGO officials,” says Blaustein, who has lately been<br />
in touch with interested scientists from Switzerland and<br />
the United States.<br />
The project got up and running thanks to an overseas<br />
donor and input from University of Haifa pollination and<br />
plant ecologist Amos Dafni, landscape ecologist Lior<br />
Blank, environmental management expert Shay Levy,<br />
geography professors Noam Greenbaum and Dan Malkinson,<br />
and London green roofs and eco-design expert<br />
Gary Grant.<br />
Doctoral candidate Amiel Vasl is in charge of the experiment<br />
on the Student Union building, while master’s<br />
degree candidate Ariel Solodar will be testing the feasibility<br />
of using “gray water” coming from the building’s<br />
sinks to irrigate the plants and purify the water.<br />
Blaustein explains that the growing substrate and foliage<br />
on green roofs keep buildings insulated from heat<br />
and cold so there is less need to use energy for keeping<br />
the interior at a comfortable temperature. And by soaking<br />
up rain before it hits the non-absorbent asphalt or<br />
concrete below, green roofs can prevent flash flooding<br />
in urban environments.<br />
The center was inaugurated in October with the backing<br />
of an international advisory board that includes,<br />
among others, eco-architect Ayal Ronen from Bezalel<br />
Academy of Art and Design in Jerusalem; Rakefet Sinai,<br />
an architect affiliated with the Technion-Israel Institute of<br />
Technology; and Howard Wenger, California-based president<br />
of SunPower and various gardening companies.<br />
Source: http://israel21c.org/environment/turning-israeliroofs-into-green-habitats/<br />
ISSUE NO. 46 DECEMBER 2012 INTERNATIONAL ASSOCIATION FOR URBAN CLIMATE
In the <strong>News</strong> 5<br />
Heat, Flood or Icy Cold, Extreme Weather Rages Worldwide<br />
January 2013 — Britons may remember 2012 as the<br />
year the weather spun off its rails in a chaotic concoction<br />
of drought, deluge and flooding, but the unpredictability<br />
of it all turns out to have been all too predictable:<br />
Around the world, extreme has become the new commonplace.<br />
Especially lately. China is enduring its coldest winter<br />
in nearly 30 years. Brazil is in the grip of a dreadful heat<br />
spell. Eastern Russia is so freezing — minus 50 degrees<br />
Fahrenheit, and counting — that the traffic lights recently<br />
stopped working in the city of Yakutsk.<br />
Bush fires are raging across Australia, fueled by a record-shattering<br />
heat wave. Pakistan was inundated by<br />
unexpected flooding in September. A vicious storm<br />
bringing rain, snow and floods just struck the Middle<br />
East. And in the United States, scientists confirmed this<br />
week what people could have figured out simply by going<br />
outside: last year was the hottest since records began.<br />
“Each year we have extreme weather, but it’s unusual<br />
to have so many extreme events around the world at<br />
once,” said Omar Baddour, chief of the data management<br />
applications division at the World Meteorological<br />
Organization, in Geneva. “The heat wave in Australia; the<br />
flooding in the U.K., and most recently the flooding and<br />
extensive snowstorm in the Middle East — it’s already a<br />
big year in terms of extreme weather calamity.”<br />
Such events are increasing in intensity as well as frequency,<br />
Mr. Baddour said, a sign that climate change is<br />
not just about rising temperatures, but also about intense,<br />
unpleasant, anomalous weather of all kinds.<br />
In Britain, people are used to thinking of rain as the<br />
wallpaper on life’s computer screen — an omnipresent,<br />
almost comforting background presence. But even the<br />
hardiest citizen was rattled by the near-biblical fierceness<br />
of the rains that bucketed down, and the floods<br />
that followed, three different times in 2012.<br />
Rescuers plucked people by boat from their swamped<br />
homes in St. Asaph, North Wales. Whole areas of the<br />
country were cut off when roads and train tracks were<br />
inundated at Christmas. In Mevagissey, Cornwall, a pub<br />
owner closed his business for good after it flooded 11<br />
times in two months.<br />
It was no anomaly: the floods of 2012 followed the<br />
floods of 2007 and also the floods of 2009, which all told<br />
have resulted in nearly $6.5 billion in insurance payouts.<br />
The Met Office, Britain’s weather service, declared 2012<br />
the wettest year in England, and the second-wettest in<br />
Britain as a whole, since records began more than 100<br />
years ago. Four of the five wettest years in the last century<br />
have come in the past decade (the fifth was in 1954).<br />
The biggest change, said Charles Powell, a spokesman<br />
Snow in Jerusalem, January 2013. Photo: NYTimes<br />
for the Met Office, is the frequency in Britain of “extreme<br />
weather events” — defined as rainfall reaching the top 1<br />
percent of the average amount for that time of year. Fifty<br />
years ago, such episodes used to happen every 100 days;<br />
now they happen every 70 days, he said.<br />
The same thing is true in Australia, where bush fires are<br />
raging across Tasmania and the current heat wave has<br />
come after two of the country’s wettest years ever. On<br />
Tuesday, Sydney experienced its fifth-hottest day since<br />
records began in 1910, with the temperature climbing to<br />
108.1 degrees. The first eight days of 2013 were among<br />
the 20 hottest on record.<br />
Every decade since the 1950s has been hotter in Australia<br />
than the one before, said Mark Stafford Smith, science<br />
director of the <strong>Climate</strong> Adaptation Flagship at the<br />
Commonwealth Scientific and Industrial Research Organization.<br />
To the north, the extremes have swung the other way,<br />
with a band of cold settling across Russia and Northern<br />
Europe, bringing thick snow and howling winds to Stockholm,<br />
Helsinki and Moscow. (Incongruously, there were<br />
also severe snowstorms in Sicily and southern Italy for<br />
the first time since World War II; in December, tornadoes<br />
and waterspouts struck the Italian coast.)<br />
In Siberia, thousands of people were left without heat<br />
when natural gas liquefied in its pipes and water mains<br />
burst. Officials canceled bus transportation between<br />
cities for fear that roadside breakdowns could lead to<br />
deaths from exposure, and motorists were advised not<br />
to venture far afield except in columns of two or three<br />
cars. In Altai, to the east, traffic officials warned drivers<br />
not to use poor-quality diesel, saying that it could become<br />
viscous in the cold and clog fuel lines.<br />
Meanwhile, China is enduring its worst winter in recent<br />
memory, with frigid temperatures recorded in Harbin,<br />
in the northeast. In the western region of Xinjiang,<br />
more than 1,000 houses collapsed under a relentless onslaught<br />
of snow, while in Inner Mongolia, 180,000 livestock<br />
froze to death. The cold has wreaked havoc with<br />
ISSUE NO. 46 DECEMBER 2012 INTERNATIONAL ASSOCIATION FOR URBAN CLIMATE
In the <strong>News</strong><br />
crops, sending the price of vegetables soaring.<br />
Way down in South America, energy analysts say that<br />
Brazil may face electricity rationing for the first time<br />
since 2002, as a heat wave and a lack of rain deplete<br />
the reservoirs for hydroelectric plants. The summer has<br />
been punishingly hot. The temperature in Rio de Janeiro<br />
climbed to 109.8 degrees on Dec. 26, the city’s highest<br />
temperature since official records began in 1915.<br />
At the same time, in the Middle East, Jordan is battling<br />
a storm packing torrential rain, snow, hail and floods that<br />
are cascading through tunnels, sweeping away cars and<br />
spreading misery in Syrian refugee camps. Amman has<br />
been virtually paralyzed, with cars abandoned, roads impassable<br />
and government offices closed.<br />
Israel and the Palestinian territories are grappling with<br />
similar conditions, after a week of intense rain and cold<br />
winds ushered in a snowstorm that dumped eight inches<br />
in Jerusalem alone.<br />
Amir Givati, head of the surface water department at<br />
the Israel Hydrological Service, said the storm was truly<br />
unusual because of its duration, its intensity and its<br />
breadth. Snow and hail fell not just in the north, but as<br />
far south as the desert city of Dimona, best known for its<br />
nuclear reactor.<br />
In Beirut on Wednesday night, towering waves<br />
crashed against the Corniche, the seaside promenade<br />
downtown, flinging water and foam dozens of feet in the<br />
air as lightning flickered across the dark sea at multiple<br />
points along the horizon. Many roads were flooded as<br />
hail pounded the city.<br />
Several people died, including a baby boy in a family<br />
of shepherds who was swept out of his mother’s arms by<br />
floodwaters. The greatest concern was for the 160,000<br />
Syrian refugees who have fled to Lebanon, taking shelter<br />
in schools, sheds and, where possible, with local families.<br />
Some refugees are living in farm outbuildings, which are<br />
particularly vulnerable to cold and rain.<br />
Barry Lynn, who runs a forecasting business and is a<br />
When Hurricane Sandy approached the east<br />
coast of the US in late October 2012, the country’s<br />
most populous meropolitan area got a close look<br />
at extreme weather. The largest preemptive public<br />
transportation shutdown in US history may have<br />
been a sign to residents of New York, Philadelphia,<br />
Baltimore, and Washington, D.C. that such storms<br />
could have increasingly urban implications. In a poll<br />
of New Yorkers, 69% said they consider Sandy and<br />
other recent tropical storms to be associated with<br />
global climate change, and officials spoke publicly<br />
about their expectations that “extreme” events are<br />
likely to become the new norm.<br />
Snow in Jerusalem, January 2013. Photo: Flash90<br />
lecturer at the Hebrew University’s department of earth<br />
science, said a striking aspect of the whole thing was the<br />
severe and prolonged cold in the upper atmosphere, a<br />
big-picture shift that indicated the Atlantic Ocean was<br />
no longer having the moderating effect on weather in<br />
the Middle East and Europe that it has historically.<br />
“The intensity of the cold is unusual,” Mr. Lynn said.<br />
“It seems the weather is going to become more intense;<br />
there’s going to be more extremes.”<br />
In Britain, where changes to the positioning of the jet<br />
stream — a ribbon of air high up in the atmosphere that<br />
helps steer weather systems — may be contributing to<br />
the topsy-turvy weather, people are still recovering from<br />
the December floods. In Worcester last week, the river<br />
Severn remained flooded after three weeks, with playing<br />
fields buried under water.<br />
In the shop at the Worcester Cathedral, Julie Smith,<br />
54, was struggling, she said, to adjust to the new uncertainty.<br />
“For the past seven or eight years, there’s been a serious<br />
incident in a different part of the country,” Mrs. Smith<br />
said. “We don’t expect extremes. We don’t expect it to be<br />
like this.” Source: NYTimes.com<br />
Atlantic City meets Sandy: October 29, 2012.<br />
ISSUE NO. 46 DECEMBER 2012 INTERNATIONAL ASSOCIATION FOR URBAN CLIMATE
Feature 7<br />
Classification of Local <strong>Climate</strong> Zones from multitemporal remote<br />
sensing data<br />
By Benjamin Bechtel<br />
KlimaCampus, University of Hamburg, Germany<br />
benjamin.bechtel@uni-hamburg.de<br />
The local climate zone (LCZ) scheme recently introduced by Stewart & Oke yields great potential to standardise<br />
the classification of local scale landscapes in urban climatology. To ensure higher comparability<br />
of measurement sites and results from various study areas, each LCZ class is defined by a standard set<br />
of morphological and land cover properties from the canopy layer. To increase the scheme’s objectivity<br />
and transferability, the scheme includes fact sheets that contain quantitative metadata for each LCZ class.<br />
Since LCZs were not designed for mapping purposes, the classification of a larger domain like an entire city<br />
is a demanding task which requires considerable expert knowledge, time, as well as certain modification<br />
to the original LCZ concept. Therefore, in this study it was investigated whether LCZ can be automatically<br />
classified from multitemporal remote sensing data from different sources, including satellite multispectral<br />
and thermal data as well as morphological features from airborne interferometric SAR. The results for<br />
Hamburg with different classifiers (among them Support Vector Machines, Multilayer Perceptron Networks<br />
and Random Forest) are quite promising. Especially multitemporal thermal infrared data (containing information<br />
from different irradiation conditions) yielded high potential for LCZ classification with overall<br />
accuracies of up to 96.3 %. Multitemporal multispectral data including NDVI reached 95.1% and automatically<br />
selected features from different sensors and pre-processing methods up to 97.4 %. Hence, LCZ can be<br />
automatically classified and remote sensing can contribute to a better characterization of urban surfaces<br />
with respect to their microclimatic properties. Further, the classified LCZ for Hamburg roughly correspond<br />
with the city’s heat island pattern as derived from floristic proxy data.<br />
1. Introduction<br />
The urban heat island (UHI) is the most wellknown<br />
and analysed phenomenon in urban climatology.<br />
There are several ways to measure UHI magnitude<br />
in the canopy layer, for example through the<br />
comparison of upwind-downwind air temperature<br />
differences, time trends of differences during urbanisation<br />
periods as well as differences between<br />
weekdays and weekends (Lowry, 1977). However,<br />
the most common method is the difference between<br />
measurements within a city and a rural station<br />
nearby. This method has several problems,<br />
like the assumption that the ‘rural’ station is free of<br />
urban effects and that both stations have identical<br />
meso-scale (topoclimatic) settings. An even more<br />
fundamental problem is the lack of meaningful definitions<br />
for “urban” and “rural” (Stewart & Oke, 2009).<br />
In the UHI literature a wide variety of different landscape<br />
types have been classified as urban and rural.<br />
This is partly a consequence of urban areas not<br />
being homogenous with clear borders but rather a<br />
continuum of morphologies of different densities<br />
with different degrees of imperviousness and various<br />
physical material properties. Stewart gave a review<br />
of the discrepancies in the portrayal of urban<br />
and rural sites and proposed a new approach to<br />
space classification using a ‘multidimensional, localscale<br />
landscape-classification scheme better suited to<br />
the complexity of surface climates characterising UHI<br />
in cities and regions worldwide’ (Stewart, 2007).<br />
Two years later Stewart & Oke proposed local<br />
(thermal) climate zones (LCZ) as a more purposeful<br />
local landscape classification system to quantify UHI<br />
magnitudes, and to put ‘methodological rigor’ behind<br />
their computation (Stewart & Oke, 2009). The<br />
new typology includes aspects of previous typologies<br />
from urban climate literature but is additionally<br />
aligned to fulfil clear criteria such as accessibility<br />
(universal in function and manageable in size), objectivity<br />
(measurable and testable class properties<br />
which are relevant to surface thermal climate), and<br />
inclusiveness (sufficiently generic in the representa-<br />
ISSUE NO. 46 DECEMBER 2012 INTERNATIONAL ASSOCIATION FOR URBAN CLIMATE
Feature<br />
Figure 1. Features from different sources included in the classification.<br />
tion in order not to inherit regional or cultural biases).<br />
The final version of the scheme was recently<br />
published and comprises ten built and seven land<br />
cover types, as well as variable land cover properties<br />
(Stewart & Oke, 2012).<br />
The LCZ scheme helps to standardise the classification<br />
of local landscapes and urban morphologies<br />
in the field of urban climatology. Although the<br />
classification system first serves as a framework for<br />
improved metadata communication in observational<br />
heat island studies, other applications were<br />
proposed including climate modelling and weather<br />
forecasting with urban canopy parameters derived<br />
from LCZ and planning tools based on spatial databases<br />
for urban form and cover (Stewart & Oke,<br />
2012). These applications require a spatially extensive<br />
classification of LCZs which is not trivial, since<br />
it involves considerable expert knowledge and is<br />
very time consuming when conducted for a large<br />
domain. Therefore, an automated classification of<br />
LCZ would be an asset for studies in urban climatology.<br />
The most promising data source for such<br />
an automated and extensive classification of LCZ is<br />
multitemporal remote sensing. In this study it was<br />
investigated whether LCZ can be automatically derived<br />
from such data and which features and classifiers<br />
are most suitable. The idea was introduced<br />
in (Bechtel, 2011); the complete study is published<br />
in (Bechtel & Daneke, 2012). This paper includes a<br />
summary of the most important findings as well as<br />
additional results. Further, the derived classes were<br />
tested with a UHI pattern derived from floristic<br />
proxy data.<br />
2. Data and methods<br />
For the case study, the city of Hamburg in Northern<br />
Germany was chosen. It has approximately 1.8<br />
million inhabitants and is a good example of a European<br />
metropolis. It has a rather moderate climate and<br />
a mean UHI of about 1.1 K (Schlünzen et al., 2010).<br />
ISSUE NO. 46 DECEMBER 2012 INTERNATIONAL ASSOCIATION FOR URBAN CLIMATE
Feature 9<br />
Features for classification<br />
For this study, features from different sources<br />
were considered. The sensors include airborne Interferometric<br />
Synthetic Aperture Radar (IFSAR) and<br />
the multispectral and thermal sensors onboard<br />
Landsat 4, 5 and 7.<br />
The geometric features were derived from the<br />
IFSAR data and contain information about the obstacles,<br />
their height, density and orientation. While<br />
heightstat only contains descriptive statistic measures<br />
like maximum, minimum, mean and variance<br />
of heights within one grid-cell, morph is a morphological<br />
opening and closing profile, and fft a spatial<br />
spectral signature derived by Fourier Transformation<br />
and spectral filtering with different band pass<br />
and sectoral filters.<br />
The multispectral features (MS) were derived<br />
from Landsat multispectral data in visible, near and<br />
middle infrared wavelength as well as the Normalized<br />
Differenced Vegetation Index (NDVI) from different<br />
acquisition times. They contain information<br />
about the albedo, the composition of surface materials<br />
as well as the vegetation.<br />
The multitemporal thermal infrared features<br />
(TIR) were also derived from Landsat and contain<br />
information about the surface temperature and<br />
differential heating patterns under diverse irradiation<br />
conditions. Hence, the annual cycle parameters<br />
(ACP) describe the mean annual cycle in the surface<br />
temperature with a simple sine function (Bechtel,<br />
2012).<br />
Although many features can be related to the urban<br />
energy balance or aerodynamic characteristics,<br />
the approach is inductive and machine learning<br />
tools were applied to chose the most relevant features.<br />
Since LCZ are defined at horizontal scales of<br />
10 2 to 10 4 m, all features were resampled to a common<br />
100 m grid. An overview of the parameters is<br />
given in Figure 1; for further information about the<br />
features and the processing see Bechtel & Daneke<br />
(2012).<br />
Training data<br />
LCZ are defined as “regions of uniform surface<br />
cover, structure, material, and human activity that<br />
span hundreds of meters to several kilometers in horizontal<br />
scale” with a “characteristic screenheight temperature<br />
regime” (Stewart & Oke, 2012). In the time<br />
between the first and most recent publications of<br />
LCZs (in 2009 and 2012, respectively) the scheme<br />
evolved considerably. Since in this study the typology<br />
served as an interface to other sub-projects (e.g.<br />
an urban system model for land use scenarios) and<br />
thus had to be determined in the beginning, a rather<br />
early version of the LCZ was applied. However,<br />
most of the 2009 classes can be transferred to the<br />
2012 scheme, and it is assumed that the proposed<br />
method works as well with this most recent version<br />
of LCZs.<br />
In addition, a few further aspects need to be considered<br />
from a “pattern recognition” point of view.<br />
First, the classification requires a rather low variability<br />
within a class not only with respect to canopy<br />
layer thermal climate but also the features used for<br />
classification. It will fail if the internal heterogeneities<br />
of the classes become too big. Since the LCZ<br />
typology is ‘inherently generic’ its partitioning into<br />
individual classes does not perfectly suit the existing<br />
morphologies in Hamburg. In particular, there<br />
is a wide variety of compact morphologies with<br />
four to six storeys and very different geometric layouts<br />
(mostly with trees) which all would be LCZs<br />
2, 2 5 or 5 in the 2012 scheme. Hence the compact<br />
morphologies were split into urbcore (LCZ 2), urbdens<br />
(perimeter block buildings of uniform height<br />
with courtyards in the center), and terrace (regular<br />
pattern aligned in rows) instead. Likewise, the class<br />
Extensive Lowrise from the 2009 scheme was split<br />
into industr (LCZ 8) and port (LCZ 8 G) since Hamburg<br />
comprises large harbour areas which ‘look’<br />
different for the classifier because of container-arrays<br />
and water bodies. The classes modcore, blocks,<br />
and reghous are equivalent to the respective 2009<br />
(2012) classes: Modern Core (LCZ 1), Blocks (LCZ 4)<br />
and Regular Housing (LCZ 6).<br />
The second issue that needs to be addressed is<br />
completeness. Since the classification is extensive<br />
(meaning a class is assigned to every pixel), some<br />
additional classes had to be introduced to prevent<br />
misclassification. Allotment gardens are a specific<br />
local landscape in Germany with small huts in a<br />
natural setting (roughly LCZ B 7) while rail is a special<br />
case of LCZ 8. Since the split classes can be reaggregated<br />
and the additional classes can be removed<br />
post-classification, these changes do not<br />
severely limit the universality of the method and a<br />
‘pure’ LCZ map can easily be derived.<br />
For each of the classes, representative reference<br />
ISSUE NO. 46 DECEMBER 2012 INTERNATIONAL ASSOCIATION FOR URBAN CLIMATE
Feature 10<br />
Figure 2. Overall accuracy for predefined feature sets and different classifiers.<br />
areas were manually digitized using maps and very<br />
high resolution multispectral data. From these areas,<br />
about one fourth of the pixels were reserved for<br />
testing while the rest were used to train the classifiers.<br />
Classifiers and feature selection<br />
To test the suitability of the chosen features for<br />
LCZ classification, three experiments were conducted.<br />
First the single feature sets were used for<br />
pixel-based supervised classification with a number<br />
of up-to-date classifiers including naïve Bayes (NB),<br />
support vector machine (SVM), neuronal networks<br />
(NN) and random forest (RF). Since all classifiers are<br />
trained, prior calibration of the features (to reflectance<br />
and surface temperature instead of radiance)<br />
was not considered necessary (Song et al., 2001).<br />
In the second experiment, feature sets of different<br />
sizes from all sources were selected with the<br />
minimum redundancy maximal relevance (MRMR)<br />
feature selection (Peng et al., 2005). The algorithm<br />
selects features with high relevance for classification<br />
and low redundancy with the prior chosen features<br />
by a mutual information criterion (called MID<br />
or MIQ for difference and quotient respectively).<br />
In the third experiment, different configurations<br />
of RF and NN classifiers were tested for their performance.<br />
RF is an ensemble of tree-structured classifiers<br />
which vote for the result. Hence the number of<br />
trees and the number of features used for each tree<br />
can be varied. For NN, number and size of the hidden<br />
layers between the input layer (features) and<br />
the output layer (classes) were varied.<br />
Thermal differentiation of LCZ<br />
In addition to the performance evaluation, the<br />
surface-air temperature of the derived classes should<br />
be evaluated. Unfortunately, in Hamburg no data is<br />
available that fulfils the scientific requirements for<br />
observational heat island studies formulated by<br />
Stewart (2011). However, a mean heat island pattern<br />
from floristic proxy data (UHI EIT, EIT = Ellenberg<br />
indicator values for temperature) was recently published<br />
by Bechtel & Schmidt (2011). The pattern was<br />
derived from the distribution of established, spontaneous<br />
vascular plant species as recorded in a comprehensive<br />
floristic mapping and calibrated with<br />
mean daily UHI observations at five stations from<br />
ISSUE NO. 46 DECEMBER 2012 INTERNATIONAL ASSOCIATION FOR URBAN CLIMATE
Feature 11<br />
one decade (Schlünzen et al., 2010). Although the<br />
pattern is likely to contain further effects (including<br />
meso-scale differences inherited from the calibration<br />
data), the resulting data set shows a clear heat<br />
island pattern that is assumed to be predominantly<br />
related to the mean canopy layer air temperature<br />
over a longer time. Hence, while the exact numbers<br />
of the UHI EIT are not particularly reliable, the dataset<br />
has the great advantage of complete ‘observations’<br />
on a 1 km raster and integration across a longer<br />
time (Gödde & Wittig, 1983). In this study the UHI EIT<br />
(derived from mean EIT from at least 80 species) of<br />
the derived classes were evaluated for the classified<br />
LCZ. Since Stewart & Oke (2012) recommend the use<br />
of homogenous patches of 200 – 500 m radius, the<br />
derived class memberships were first filtered by a<br />
morphological opening with a disk-shape structuring<br />
element of 400 m radius and only the homogenous<br />
patches were assigned to their closest UHI EIT<br />
value.<br />
3. Results<br />
Figure 3. Overall accuracy for selected feature sets with MRMR/MID and different classifiers.<br />
Classification of LCZ<br />
The results of the predefined feature sets with<br />
different classifiers are shown in Figure 2. The given<br />
numbers indicate the overall accuracy (OA, percentage<br />
of correctly classified pixels of the testing data).<br />
Naïve Bayes performed less well than the more<br />
sophisticated classifiers. SVM is especially useful for<br />
very large feature sets (e.g. MS with 198 features)<br />
but it was mostly outperformed by NN and RF. Regarding<br />
the feature sets, multitemporal MS (95.1 %<br />
with NN) and TIR (96.3 % with NN) data showed the<br />
best results. This is very convenient, since these<br />
data are available worldwide at no charge. FFT and<br />
especially morph showed better results than the<br />
simple height statistics, indicating an added value<br />
of the incorporated spatial information. However,<br />
the morphological features did not reach the performance<br />
of TIR and MS. For the larger feature sets,<br />
selected subsets of 20 features were tested in addition,<br />
which performed slightly worse in all cases.<br />
Figure 3 shows the results for feature sets of different<br />
sizes selected by MRMR with the mutual information<br />
difference criterion. It can be seen that<br />
all classifiers rapidly improved their performance<br />
between 2 and 10 features. With more than 10 features<br />
the performance of NB decreased (because<br />
the assumption of conditional independency is violated)<br />
and the performances of the other classifiers<br />
ISSUE NO. 46 DECEMBER 2012 INTERNATIONAL ASSOCIATION FOR URBAN CLIMATE
Feature 12<br />
Figure 4. Homogenous LCZ patches from classification and floristic heat island pattern UHI EIT.<br />
improved more slowly (because of the high redundancy<br />
in the dataset). RF and NN reached a plateau<br />
at about 50 features while SVM performed less well<br />
but still improved with larger datasets. Again NN<br />
and RF outperformed the other classifiers. All predefined<br />
feature sets were represented within the<br />
top 20 selected features.<br />
In the third experiment, different configurations<br />
of the best classifiers NN and RF were tested with<br />
one feature set. TIR as the best predefined set and<br />
50 MRMR features were selected. Table 1 shows that<br />
the results were slightly improved with more complex<br />
classifiers. However, which classifier performed<br />
best depended on the feature set.<br />
Thermal differentiation with floristic UHI pattern<br />
The floristic heat island pattern and the homogenous<br />
patches of selected classes from the neuronal<br />
network classification with 100 features (MRMR/<br />
MIQ) are shown in Fig. 4. Thermal differences be-<br />
Table 1: Results of experiment 3 – different NN and<br />
RF classifiers. F: number of features, C: number of<br />
classes. Best input parameters for respective classifier<br />
and feature set are highlighted in blue colour.<br />
hidden<br />
layers / trees<br />
tir_20 tir<br />
MRMR/<br />
MID 50<br />
ISSUE NO. 46 DECEMBER 2012 INTERNATIONAL ASSOCIATION FOR URBAN CLIMATE<br />
Neuronal Network<br />
Random Forest<br />
40,30,20<br />
50,30,15<br />
F<br />
F,C<br />
F,F,C<br />
10 trees<br />
30 trees, 20 feat<br />
50 trees, 30 feat<br />
60 trees, 20 feat<br />
0.940<br />
0.932<br />
0.934<br />
0.925<br />
0.924<br />
0.922<br />
0.921<br />
0.920<br />
0.923<br />
0.962<br />
0.967<br />
0.963<br />
0.951<br />
0.966<br />
0.922<br />
0.938<br />
0.936<br />
0.938<br />
0.939<br />
0.946<br />
0.960<br />
0.952<br />
0.955<br />
0.924<br />
0.948<br />
0.945<br />
0.951
Feature 13<br />
tween the port areas, the dense inner city and the<br />
less compact suburban areas are clearly visible.<br />
Fig. 5 shows the (floristic) heat island for different<br />
LCZs. First, it is noticeable that the natural land<br />
cover type forest (LCZ A) also shows a certain heat<br />
island signal. This indicates a meso-scale bias inherited<br />
from the calibration data and as stated before,<br />
the absolute numbers should not be taken too seriously.<br />
The relative differences however are much<br />
more reliable, and show a clear thermal differentiation<br />
in UHI EIT between forest (LCZ A), the medium<br />
dense class Regular Housing (LCZ 6), and the dense<br />
urban (LCZs 2, 2 5 and 5) as well as commercial/industrial<br />
classes (LCZ 8 and 8 G).<br />
The differentiation matches the expectations<br />
quite well except for the large UHI of the terrace<br />
(LCZ 5) class. In a one-way analysis of variance combined<br />
with a multiple comparison test based on the<br />
Tukey’s honestly significant difference criterion the<br />
differences in the class means were significant for<br />
most class pairs (except LCZs [6,B], [8,2], and [8 G,5]).<br />
However, this result should be treated carefully for<br />
a number of reasons. First, the sample of LCZ estimates<br />
is much larger than the number of independent<br />
UHI EIT estimates, resulting in an overestimation<br />
Figure 5. Floristic heat island UHI EIT for classified LCZ.<br />
of the significance. Secondly, the co-occurrence of<br />
other LCZs in the 1 km UHI EIT grid was neglected. Besides,<br />
the limitation to large homogenous patches<br />
resulted in an exclusion of large areas due to the<br />
noisy nature of the pixel-based classification. Furthermore,<br />
considering the origin of the UHI EIT data,<br />
which clearly fails the criteria for observational studies,<br />
the validity of this result is certainly somewhat<br />
limited. Nevertheless, besides the acknowledged<br />
limitations, the UHI pattern based on floristic proxy<br />
data is a novel dataset and can still be seen as a small<br />
contribution to the validation of LCZs.<br />
4. Conclusion<br />
The central findings of this study are:<br />
• The automated classification of LCZ is possible<br />
with very good OA of > 95 %.<br />
• Different features are suitable, especially multitemporal<br />
TIR and MS data, which are freely available<br />
from Landsat.<br />
• Morphological features can be used to improve<br />
the classification but are not sufficient alone.<br />
• NN and RF classifiers are very powerful for the<br />
classification and can be optimised.<br />
• Choice of the right classifier is about as impor-<br />
ISSUE NO. 46 DECEMBER 2012 INTERNATIONAL ASSOCIATION FOR URBAN CLIMATE
Feature 14<br />
tant as the right input data.<br />
• The classified LCZs show (significantly) different<br />
mean thermal characteristics (derived from floristic<br />
proxy data).<br />
More case studies shall be conducted to see<br />
whether the results can be reproduced for other<br />
cities. In the future, the 2012 version of LCZs will<br />
be used. However, for the classification it might be<br />
necessary to prior define subclasses and additional<br />
classes in order to get a more comprehensive representation<br />
of the local morphologies and landscapes.<br />
Since this partly contradicts the aim of generalisation,<br />
it should be evaluated whether these<br />
(especially diverse compact morphologies in European<br />
cities) only effect the automated classification<br />
or also result in different canopy layer climates to<br />
find the most appropriate division of the landscape<br />
universe. Further, more standardised features shall<br />
be developed in order to create transferable classifiers<br />
and to investigate the properties of the different<br />
LCZ. Eventually, such an improved method will<br />
hopefully contribute to building spatial databases<br />
of urban form and cover.<br />
5. Acknowledgements<br />
I thank I. Stewart for very constructive remarks<br />
on the method and helpful support with the different<br />
LCZ versions, E. Rauch, J. Böhner & J. Young for<br />
further valuable comments on the manuscript, H.<br />
Peng and colleagues for the MRMR code, the University<br />
of Waikato for WEKA, as well as O. Conrad<br />
for SAGA-GIS. Further, I thank the NASA, the USGS,<br />
Intermap Technologies and the Botanischer Verein<br />
zu Hamburg for the data.<br />
References<br />
Bechtel, B. (2011). Multisensorale Fernerkundungsdaten<br />
zur mikroklimatischen Beschreibung<br />
und Klassifikation urbaner Strukturen. Photogrammetrie-Fernerkundung-Geoinformation,<br />
2011(5), pp.<br />
325–338.<br />
Bechtel, B. (2012). Robustness of annual cycle<br />
parameters to characterize the urban thermal landscapes.<br />
Geoscience and Remote Sensing Letters, IEEE,<br />
9(5), pp. 876 –880.<br />
Bechtel, B., and Daneke, C. (2012). Classification<br />
of local climate zones based on multiple earth observation<br />
data. IEEE Journal of Selected Topics in Ap-<br />
plied Earth Observations and Remote Sensing, 5(4),<br />
pp. 1191 –1202. doi: 10.1109/JSTARS.2012.2189873<br />
Bechtel, B., and Schmidt, K. J. (2011). Floristic<br />
mapping data as a proxy for the mean urban heat<br />
island. Clim Res, 49, pp. 45–58.<br />
Gödde, M. and Wittig, R. (1983). A preliminary attempt<br />
at a thermal division of the town of Münster<br />
(North Rhine-Westphalia, West Germany) on a floral<br />
and vegetational basis. <strong>Urban</strong> Ecology, 7(3), pp.<br />
255–262.<br />
Lowry, W. P. (1977). Empirical estimation of urban<br />
effects on climate: a problem analysis. J. Appl.<br />
Meteorol., 16, pp. 129–135.<br />
Peng, H., Long, F., and Ding, C. (2005). Feature<br />
selection based on mutual information: criteria of<br />
max-dependency, max-relevance, and min-redundancy.<br />
IEEE Transactions on Pattern Analysis and Machine<br />
Intelligence, 27(8), pp. 1226–1238.<br />
Schlünzen, K. H., Hoffmann, P., Rosenhagen, G.,<br />
and Riecke, W. (2010). Long-term changes and regional<br />
differences in temperature and precipitation<br />
in the metropolitan area of hamburg. International<br />
Journal of Climatology, 30(8), pp. 1121–1136.<br />
Song, C., Woodcock, C. E., Seto, K. C., Lenney, M.<br />
P., and Macomber, S. A. (2001). Classification and<br />
change detection using landsat tm data: when and<br />
how to correct atmospheric effects? Remote Sensing<br />
of Environment, 75(2), pp. 230–244.<br />
Stewart, I. D. (2007). Landscape representation<br />
and the urban-rural dichotomy in empirical urban<br />
heat island literature 1950-2006. ACTA Climatologica<br />
et Chorologica, pp. 111–121.<br />
Stewart, I. D. (2011). A systematic review and scientific<br />
critique of methodology in modern urban<br />
heat island literature. International Journal of Climatology,<br />
31(2), pp. 200–217. doi: 10.1002/joc.2141<br />
Stewart, I. D., and Oke, T. R. (2009). Newly developed<br />
“thermal climate zones” for defining and measuring<br />
urban heat island magnitude in the canopy<br />
layer. Preprints, T.R. Oke Symposium & Eighth Symposium<br />
on <strong>Urban</strong> Environment, January 11–15, Phoenix,<br />
AZ.<br />
Stewart, I. D., and Oke, T. R. (2012). “Local <strong>Climate</strong><br />
Zones” for urban temperature studies. Bulletin of the<br />
American Meteorological Society, 93, pp. 1879–1900.<br />
ISSUE NO. 46 DECEMBER 2012 INTERNATIONAL ASSOCIATION FOR URBAN CLIMATE
<strong>Urban</strong> Projects 15<br />
Assessment of urban climate conditions in a hot humid tropical city<br />
Summary<br />
Attendant problems of urbanization on the quality of<br />
the thermal environment have been well researched in<br />
many temperate countries, but studies are relatively lacking<br />
in the low tropics. <strong>Urban</strong>isation in developing countries<br />
requires scientific approaches that can foster new<br />
ways of governance since it brings several management<br />
practices and environmental concerns into focus.<br />
The rapid growth of Akure has made it one of the fastest<br />
growing metropolitan cities in the Southwestern Nigeria.<br />
Within the last three decades, subsequent changes in<br />
the land-atmosphere energy balance relationships have<br />
occurred alongside traffic-related air quality degradation<br />
over the city. With the rapid rate of this expansion, the<br />
study of urban climatology and human impacts on the local<br />
climate and air quality has become more important.<br />
Knowing the extent of change in the transition of various<br />
land use types within the city metropolis is very important<br />
in this study. Hence, multi-temporal remote sensing data<br />
and GIS techniques with field survey were used to detect<br />
land-use/land-cover changes (LULCC) at different epochs<br />
in the city. The climatological analysis of the differences<br />
in air temperature between rural and urban areas (ΔT u-r)<br />
corroborates the existence of an urban heat island (UHI)<br />
in the city. The nocturnal heat island is observed to be<br />
more frequent than the daytime heat island and stronger<br />
during the dry season. Values of cooling degree days obtained<br />
suggest that elevated temperatures in the central<br />
urban areas both day and night will increase the potential<br />
for cooling of buildings. Also, intra-urban variations of<br />
temperature are shown to be influenced by land use and<br />
other site factors. The highlights of the cooling effects of<br />
the vigorous evapotranspiration of the city trees during<br />
both the dry and wet seasons, and the potential of trees<br />
as a cost effective UHI and climate change impact mitigation<br />
tool in Akure is presented in this regard.<br />
The Study City<br />
Figure 1. Map of the temperature stations network.<br />
Akure, the capital city of Ondo State, Nigeria is located<br />
at latitude 7.25 o N and longitude 5.20 o E. The rapid growth<br />
of the city, particularly within the last 25 years, has made<br />
it one of the fastest growing metropolitan cities in the<br />
Southwestern Nigeria. Its population has more than tripled<br />
from 157,947 in 1990 to ~500,000 in 2006 (Balogun<br />
et al., 2011). It became an administrative and economic<br />
seat to Akure South Local Government Authority, and<br />
Ondo State with the latter’s creation in 1976 from the<br />
old Western State. Since then, the city has witnessed immense<br />
growth in the size of built-up areas, number of inhabitants,<br />
transportation, and commercial activities.<br />
ISSUE NO. 46 DECEMBER 2012 INTERNATIONAL ASSOCIATION FOR URBAN CLIMATE
<strong>Urban</strong> Projects 1<br />
Table 1: Summary of site characteristics.<br />
Station Site Lat. (N) Long. (E) Elev. (m) LCZ Description<br />
1 Oja Oba 07 o 15.250’ 005 o 11.672’ 347 2 Compact midrise<br />
2 Airport 07 o 14.881’ 005 o 18.001’ 329 10 Sparsely built<br />
3 Ijapo Est 07 o 15.983’ 005 o 12.512’ 342 6 Open-set lowrise<br />
4 NTA Ondo Rd 07 o 15.030’ 005 o 07.940’ 373 14 Bush/scrub<br />
5 Aratusin 07 o 14.546’ 005 o 10.682’ 347 6 Open-set lowrise<br />
6 Ayedun 07 o 15.708’ 005 o 11.149’ 351 3 Compact lowrise<br />
7 Oshinle 07 o 14.156’ 005 o 11.442’ 361 3 Compact lowrise<br />
8 Ijoka 07 o 12.093’ 005 o 12.030’ 359 3 Compact lowrise<br />
9 Ala Qtrs 07 o 14.181’ 005 o 12.480’ 369 6 Open-set lowrise<br />
10 Alagbaka Park (Deciduous) 07 o 15.018’ 005 o 12.444’ 367 16 Close-set trees<br />
11 Alagbaka GO (Asphalt) 07 o 14.479’ 005 o 12.994’ 367 5 Open-set midrise<br />
12 Alagbaka Est 07 o 14.252’ 005 o 13.495’ 367 6 Open-set lowrise<br />
13 Oba ile 07 o 15.343’ 005 o 14.841’ 367 6 Open-set lowrise<br />
14 FUTA lawn 07 o 18.234’ 005 o 08.181’ 367 5 Open-set midrise<br />
15 FUTA tree (Evergreen) 07 o 18.222’ 005 o 08.173’ 367 15 Open-set trees<br />
16 FUTA Obk (Concrete) 07 o 17.586’ 005 o 08.975’ 367 3 Compact lowrise<br />
17 Shagari Est 07 o 17.290’ 005 o 11.601’ 367 6 Open-set lowrise<br />
The climatic condition of Akure follows the pattern<br />
of southwestern Nigeria where the climate is influenced<br />
mainly by the rain-bearing southwest monsoon winds<br />
from the ocean and the dry northwest winds from the<br />
Sahara Desert. Akure experiences a warm humid tropical<br />
climate, with two distinct seasons, the rainy and dry<br />
seasons. The rainy season lasts for about seven months,<br />
April to October. It records an average rainfall of about<br />
1500 mm per annum.<br />
Annual average temperatures range between 21.4 o C<br />
and 31.1 o C, and the mean annual relative humidity is<br />
about 77% (based on 1980-2010 data from the Nigerian<br />
Meteorological Agency). Vegetation is of the tropical<br />
rainforest type. Akure lies on a relatively flat plain of<br />
about 360 m above sea level within the Western Nigerian<br />
plains.<br />
Methodology<br />
The analysis of LULCC is predicated basically on the<br />
use of remote sensing and GIS techniques. The study<br />
utilizes diverse forms of data. Remotely sensed data −<br />
Landsat TM satellite imageries of Akure in 1986, 2002<br />
and 2007 were obtained from the Global Land Cover<br />
Facility. A year-long dataset from in situ measurements<br />
of air temperature and humidity, sampled at 5 minute<br />
intervals, was obtained from shielded portable Lascar<br />
EL-USB-2 temperature / humidity data loggers that were<br />
mounted on lamp posts above head height (3 m) at anurban<br />
site and a rural reference site.<br />
The spatio-temporal variability of the canopy-level<br />
urban heat island (UHI) of Akure is examined on the basis<br />
of observations using shielded thermochron i-button<br />
temperature loggers. Temperature data obtained from<br />
the seventeen selected sites, which include different urban<br />
areas (Central Business District-CBD, high-density<br />
and low-density housing) are compared with ‘rural’ reference<br />
data and analysed with respect to meteorological<br />
variables and differences in land use. The land use<br />
classification followed the urban climate zone scheme of<br />
Stewart and Oke (2010), as shown in Table 1.<br />
ISSUE NO. 46 DECEMBER 2012 INTERNATIONAL ASSOCIATION FOR URBAN CLIMATE
<strong>Urban</strong> Projects 17<br />
Results and Discussions<br />
Landuse Landcover change detection<br />
The older traditional central district of the city has become<br />
increasingly congested and the city has expanded<br />
outwards, depleting cultivated land and vegetation in<br />
the fringe, particularly towards the northwestern part<br />
of the city (Figure 2). Within the period under consideration<br />
(1986-2007), the built up land has increased by<br />
over 28%, consequent upon the various projects that<br />
were embarked upon after the city’s declaration as state<br />
capital and the subsequent discovery that the state falls<br />
within a region that is rich in minerals (oil and bitumen,<br />
among others). This has, however, led to the physical<br />
expansion of the city as evident in the increased land<br />
consumption rate from 0.083 to 0.160 and already having<br />
a land absorption coefficient of 0.277 between the<br />
periods of study (Balogun et al., 2011).<br />
Climatic response to urbanisation<br />
The most identified and essential index for assessing<br />
urbanisation-induced land-use changes and rapid population<br />
growth impacts on climate is the urban-rural difference<br />
in air temperature and humidity properties. The<br />
results regarding the air temperature differences ∆T u-r at<br />
both sites are presented in Figure 3. This reveals that the<br />
urban area is at all times warmer than the rural area, and<br />
this indicates the existence of an urban heat island (UHI)<br />
in Akure throughout the day except in November and<br />
December when an urban cool island (UCI) is observed<br />
for just a few hours in the afternoon. At this time there is<br />
a reversed thermal contrast, indicating a cooler city than<br />
its rural surroundings. Similar results have been reported<br />
for Barcelona (Moreno-Garcia, 1994) and Dallas (Ludwig,<br />
1968). Daytime urban-rural temperature differences (heat<br />
islands) may be positive or negative depending on the<br />
particular characteristics of the urban area and their surroundings<br />
(Runnalls and Oke, 2000). Diurnal differences<br />
of humidity content between urban and rural areas are<br />
observed to be modified according to the season of the<br />
year. The negative value means that the urban area has<br />
a lower relative humidity than the rural area. The urban<br />
environment has an influence on relative humidity at all<br />
hours, causing constant humidity privileging in the rural<br />
area throughout the day (Figure 3), and throughout the<br />
year. An urban moisture deficits (UMD) exists throughout<br />
the day for all months, with the highest differences<br />
observed at night. Also the difference was more pronounced<br />
in the dry season, from November to January.<br />
Thus maximal values of the differences occur during the<br />
dry season and at night hours. The time of maximum UHI<br />
coincides with the time of maximum UMD.<br />
Spatio-temporal characteristics of the heat island<br />
The diurnal behavioural pattern of the heat island on<br />
Figure 2. Land-use/land-cover map of Akure, in 1986,<br />
2002 and 2007 (respectively from top to bottom).<br />
ISSUE NO. 46 DECEMBER 2012 INTERNATIONAL ASSOCIATION FOR URBAN CLIMATE
<strong>Urban</strong> Projects 1<br />
Figure 3. Diurnal variation of mean monthly urban-rural differences in air temperature (left) and relative humidity<br />
(right).<br />
a synoptic hour basis is presented in Fig. 4, which shows<br />
that the Akure UHI contour patterns differ from the simple<br />
idealized concentric structure around the city centre<br />
during the dry and wet seasons respectively. Warm regions<br />
extend over the city core to the south during the<br />
cooler parts of the day (at night), while cooler regions<br />
are located in the central vegetated park area and outer<br />
fringes. The influence of different LCZs in the evolution<br />
of the UHI in Akure is of special interest in this study. The<br />
central Alagbaka park, LCZ 16 consisting of close-set 10-<br />
15 year old deciduous Teak trees (Tectona grandis) and<br />
the evergreen open-set FUTA trees, LCZ 15 (Magnifera<br />
indica) create cool island effects of 5-8 o C during both dry<br />
and wet seasons. The cooling effect is of the same magnitude<br />
during the dry season, even though the deciduous<br />
trees are devoid of leaves (DJF), but markedly different<br />
during the wet season (JJA). This is because both<br />
LCZs experience similar radiation regimes during the dry<br />
season as the ovate leaf deciduous close-set trees behave<br />
similar to the lance leaf evergreen open-set tree.<br />
Relationship between sky view factor & heat island intensity<br />
The value of SVF varies with individual canyons because<br />
of subtle differences in the street width from canyon<br />
to canyon. Figure 5 shows the relationship between<br />
UHI intensity and SVF for all built-up areas during the<br />
dry (solid diamonds) and wet (open squares) seasons of<br />
2010, excluding LCZ 3 (concrete), LCZ 5(asphalt), LCZ 5<br />
(grass lawn), LCZ 15 (evergreen trees) and LCZ 16 (deciduous<br />
trees) that have extreme thermal regimes as a<br />
result of differing surface properties in similar LCZs. The<br />
observed relationship is better during the dry (R 2 = 0.62)<br />
than wet (R 2 = 0.25) season. The strong relationship observed<br />
in the dry season (time of maximum UHI) is similar<br />
to those reported by Svensson (2004) and Yamashita et al.<br />
(1986) in Göteborg, Sweden and the cities of Tama river<br />
basin, Japan respectively. The weak relationship observed<br />
during the wet season suggests that the relationship between<br />
the UHI and SVF is not only dependent on the LCZs<br />
but also on prevailing weather conditions such as clouds<br />
and wind speed, as well as varying surface properties.<br />
Conclusion<br />
This study has investigated the impacts of urbanisation<br />
on the local climate of Akure, a hot humid tropical<br />
city in Nigeria, West Africa. The paper has illustrated that<br />
land-use and land-cover changes are closely associated<br />
with climatic responses. In this study, the potential use<br />
of remote sensing data and GIS techniques in investigating<br />
these changes has revealed some interesting findings.<br />
Results of the five classes distinctly produced for<br />
each study year indicated a rapid change in built-up<br />
and arable land as they have increased tremendously<br />
and the dense forest terribly depleted. Results further<br />
revealed the modifying effect of urbanisation on the<br />
city’s climate, resulting in the urban heat island phenomenon<br />
and urban humidity deficits. A clear linear relationship<br />
between the sky view factor and UHI intensity<br />
is obtained, which is an indication that street geometry<br />
and its regional distribution within the city play a fundamental<br />
role in generating differential air temperature<br />
patterns. Findings from this research have identified the<br />
the potential of trees as a cost effective UHI and climate<br />
change impact mitigation tool in Akure.<br />
ISSUE NO. 46 DECEMBER 2012 INTERNATIONAL ASSOCIATION FOR URBAN CLIMATE
<strong>Urban</strong> Projects 19<br />
Figure 4. Spatial and temporal variation of Akure UHI during the dry (DJF) and Wet (JJA) seasons.<br />
Figure 5. Relationship between UHI intensity and SVF<br />
for all built-up areas during the dry (solid diamonds)<br />
and wet (open squares) seasons of 2010.<br />
References<br />
Balogun I.A, Adeyewa Z.D, Balogun A.A, Morakinyo<br />
T.E (2011) Analysis of urban expansion and land use<br />
changes in Akure, Nigeria, using remote sensing and GIS<br />
techniques. Journal of Geography and Regional Planning<br />
Vol. 4(9), pp. 533-541.<br />
Ludwig FL. (1968) <strong>Urban</strong> temperature fields. In: Symposium<br />
on urban climates and building climatology (Brussels).<br />
World Meteorological Organization: 80–107.<br />
Moreno-Garcia, C.M. (1994) Intensity and form of the<br />
urban heat island in Barcelona. International Journal of<br />
Climatology 14 (6), 705- 710.<br />
Runnalls, K.E. and Oke, T.R. (2000) Dynamics and controls<br />
of the near-surface heat island of Vancouver, British<br />
Columbia. Physical Geography, 21: 281–304.<br />
Svensson D, Tarvainen L (2004) The Past and Present<br />
<strong>Urban</strong> Heat Island of Beijing, B416 Projektarbete Goteborg,<br />
Earth Sciences. Goteborg University, Sweden.<br />
Yamashita S, Sekine K, Shoda M, Yamashita K, Hara Y<br />
(1986) On the relationships between heat island and sky<br />
view factor in the cities of Tama River Basin, Japan. Atmos<br />
Environ 20:681–686.<br />
Ifeoluwa A. Balogun<br />
iabalogun@futa.edu.ng<br />
Ahmed A. Balogun<br />
Department of Meteorology<br />
Federal University of Technology<br />
Akure, Nigeria<br />
ISSUE NO. 46 DECEMBER 2012 INTERNATIONAL ASSOCIATION FOR URBAN CLIMATE
<strong>Urban</strong> Projects 20<br />
Transmissivity of solar radiation through the crowns of single urban trees<br />
1. Introduction<br />
One of the most efficient ways to regulate the local<br />
climate conditions and to reduce heat stress in cities<br />
during periods of extensive heat is to increase the vegetation<br />
cover (e.g. Akbari et al. 2001; Oke 1989; Shashua-<br />
Bar, Hoffman 2000). Cooling effects of vegetation are<br />
achieved by evapotranspiration and, in the case of trees<br />
and bushes, by their shading. While the air temperature<br />
reduction caused by single urban trees is limited, they<br />
can strongly influence outdoor thermal comfort by decreasing<br />
direct shortwave radiation and thus also the<br />
surface and radiant temperatures (Ali-Toudert, Mayer<br />
2005; Mayer et al. 2009; Oke 1989; Shashua-Bar et al.<br />
2011).<br />
While studies on the transmissivity of solar radiation<br />
through the canopies of trees are few, it has been shown<br />
that on average about 20% of total solar radiation is<br />
transmitted to the forest floor (Gay et al. 1971; Hardy et<br />
al. 2004; Oke 1987; Ni et al. 1997; Pomeroy, Dion 1996).<br />
The forest canopies were also found to strongly diffuse<br />
the solar radiation transmitted to the forest floor (Gay et<br />
al. 1971; Oke 1987).<br />
In cities, properly chosen and located trees can significantly<br />
reduce cooling loads in buildings (Simpson,<br />
McPherson 1996) and be beneficial for mitigating outdoor<br />
heat stress in the summer. However, the seasonal<br />
variability of transmissivity of deciduous trees plays an<br />
important role, especially in high latitude cities, where<br />
the shading effect of defoliated trees can reduce already<br />
limited solar access to the buildings and street canyons<br />
(e.g. Cantón et al. 1994). Knowledge about the actual<br />
values of transmissivity of solar radiation through the<br />
crowns of single urban trees and their variations among<br />
different species and seasons can provide useful information<br />
with regards to climate sensitive planning and<br />
modelling of outdoor thermal comfort in cities.<br />
The objective of the study is to measure the transmissivity<br />
of total and direct solar radiation through the<br />
crowns of single street trees, both foliated and leafless,<br />
in a high latitude city.<br />
2. Methods<br />
Four deciduous trees – Aesculus hippocastanum<br />
(horse chestnut), Tilia cordata (small-leaved linden), Betula<br />
pendula (silver birch) and Prunus sp. (cherry), as well<br />
as a coniferous Pinus nigra (European black pine), were<br />
chosen for the study. All five tree species, in particular<br />
the deciduous ones, are common in northern European<br />
cities including Göteborg. The selected trees are fully<br />
grown and in good condition, located at relatively flat<br />
and open sites. The dimensions of the trees are listed in<br />
Table 1 and their locations are shown in Figure 1.<br />
Figure1. Location of the measurement points: 1 – chestnut, 2 – linden, 3 – birch, 4 – cherry, 5 – pine, R – reference<br />
point. Photograph source: kartor.eniro.se<br />
ISSUE NO. 46 DECEMBER 2012 INTERNATIONAL ASSOCIATION FOR URBAN CLIMATE
<strong>Urban</strong> Projects 21<br />
Two calibrated DeltaT® SPN1 sunshine pyranometers<br />
were used to measure the transmissivity of total and direct<br />
shortwave radiation (τ G and τ I, respectively) through<br />
the selected trees. One of the instruments was located<br />
a few meters north of one of the studied trees, at the<br />
height of 1.1 m corresponding to the height of the centre<br />
of gravity of an average European male (Mayer and<br />
Hoppe 1987; Mayer et al. 2009), and the other at a reference<br />
point located on top of a 4-storey high building.<br />
The deciduous trees are located within the radius of 400<br />
meters from the reference point, while the coniferous<br />
tree is located about 2 km northeast. The exact position<br />
of the sensor located underneath the trees was chosen<br />
depending on the tree height and diameter, to provide<br />
the longest time of measurements in both summer and<br />
winter. Total solar irradiance (G) and the diffuse component<br />
(D) were recorded as 10 min averages, and the direct<br />
component on a horizontal surface (I h) was later calculated<br />
by subtracting the diffuse from total radiation.<br />
The measurements were conducted on nine clear<br />
days in different seasons of 2011 and 2012. Measurements<br />
under each of the deciduous trees were conducted<br />
twice, in foliated and leafless conditions. The morning<br />
and late afternoon periods, when the instrument<br />
was not shaded by the studied tree, were excluded from<br />
the analysis. On one of the measurement days the sky<br />
became partly cloudy in the afternoon, which sharply<br />
decreased the direct component of the shortwave radiation.<br />
Data from this period has not been analysed.<br />
τ G and τ I were calculated as the ratio of irradiance<br />
measured under the crown of the tree to that incident<br />
upon it, at the reference point (Cantón et al. 1994; Hardy<br />
et al. 2004):<br />
τ G = G’/G [1]<br />
and<br />
τ I =I h’/I h [2]<br />
where the apostrophe accounts for the radiation measured<br />
in the shadow of the studied tree.<br />
3. Results and discussion<br />
Diurnal courses of total and direct solar radiation at<br />
the reference point (G and I h) and below the canopy of<br />
studied trees (G’ and I h’) are shown in Figure 2. Mean values<br />
of τ G and τ I as well as standard deviation (σ) are listed<br />
in Table 2.<br />
In summer the dense, foliated crowns of studied trees<br />
were almost impermeable for the direct component of<br />
shortwave radiation. τ I was found to be very weak, particularly<br />
in the cases of linden and chestnut (1.3% and<br />
1.7%, respectively). Even the birch, which in comparison<br />
to other trees has a relatively sparse and heterogeneous<br />
crown, had a mean transmissivity of only 3.6% in the<br />
Table 1. Dimensions of the studied trees.<br />
H – height, h – trunk height, Ф – diameter<br />
Tree H (m) h (m) Ф (m)<br />
Aesculus hippocastanum<br />
(horse chestnut)<br />
Tilia cordata<br />
(small-leaved linden)<br />
Betula pendula<br />
(silver birch)<br />
Prunus sp.<br />
(cherry)<br />
Pinus nigra<br />
(European black pine)<br />
13.5 2.0 11.0<br />
16.6 1.5 12.0<br />
18.5 3.0 14.0<br />
8.5 1.0 13.0<br />
8.0 2.4 4.0<br />
Table 2. Mean and standard deviation (σ) of<br />
transmissivity of direct (τ I) and total (τ G) shortwave<br />
radiation through the crowns of studied trees.<br />
ISSUE NO. 46 DECEMBER 2012 INTERNATIONAL ASSOCIATION FOR URBAN CLIMATE<br />
Tree<br />
Chestnut<br />
Linden<br />
Birch<br />
Cherry<br />
Pine<br />
τI<br />
τG<br />
τI<br />
τG<br />
τI<br />
τG<br />
τI<br />
τG<br />
τI<br />
τG<br />
Defoliated<br />
τ (%) σ<br />
51.9<br />
57.4<br />
50.8<br />
54.2<br />
51.1<br />
59.0<br />
40.2<br />
48.0<br />
N/A<br />
N/A<br />
0.27<br />
0.24<br />
0.23<br />
0.21<br />
0.31<br />
0.28<br />
0.21<br />
0.19<br />
N/A<br />
N/A<br />
Foliated<br />
τ (%) σ<br />
1.7<br />
9.8<br />
1.3<br />
8.4<br />
3.6<br />
14.5<br />
5.3<br />
13.9<br />
5.1<br />
12.2<br />
0.03<br />
0.04<br />
0.03<br />
0.04<br />
0.06<br />
0.05<br />
0.07<br />
0.07<br />
0.06<br />
0.07<br />
summer. Such low values of transmissivity indicate that<br />
the canopy of single trees can strongly influence the radiation<br />
balance and thermal comfort in urban areas.<br />
In winter the diurnal variability of transmissivity of direct<br />
radiation through the leafless deciduous trees was<br />
high (with σ of 0.25), as there were no leaves giving constant<br />
shade (Fig. 2, Table 2). Values of τ I ranged from 0%,<br />
when the radiometers were shaded by the trunk of the<br />
tree (e.g. Fig. 2b, hours 12-13), to 100%, when the radiation<br />
beam could find an unobstructed way through the<br />
canopy. The mean τ I, however, was similar for all trees<br />
and amounted to 50.8-51.9% except for the cherry tree
<strong>Urban</strong> Projects 22<br />
Figure 2 (a-i). Diurnal course of the total (G) and direct (I h) solar radiation above and below the canopies of the<br />
studied trees: chestnut (a, b), linden (c, d), birch (e, f), cherry (g, h) and pine (i), both foliated (left) and leafless<br />
(right). Data recorded by the radiometers located under the tree of interest (G’and I h’) is limited to the time when<br />
the radiometer was shaded by its crown. Data from period when the instrument located under the linden tree<br />
was shaded by an adjacent building (Fig. 2d) and when clouds appeared during the measurements under the<br />
birch (Fig. 2e) are not shown. Temporary drops in irradiance at the reference point, visible around 6 a.m. and 11<br />
a.m., are caused by shading by an adjacent building and anemometer mast.<br />
ISSUE NO. 46 DECEMBER 2012 INTERNATIONAL ASSOCIATION FOR URBAN CLIMATE
<strong>Urban</strong> Projects 23<br />
(Table 2). Even though the cherry is the shortest of all<br />
four trees, it has a relatively wide, dense crown with thick<br />
branches. In winter it had the lowest transmissivity of all<br />
trees (40.2%).<br />
In cities, the diffuse and reflected radiation is not only<br />
transmitted through the crown of a tree, but can reach<br />
the trunk zone from the surroundings – open areas, adjacent<br />
buildings etc. At the same time, the direct component<br />
is strongly diminished in the tree shadow. For this<br />
reason, the proportion of diffuse radiation under the tree<br />
is significantly higher than above its canopy. While on a<br />
sunny day the direct component amounts to about 85%<br />
of the total incident solar radiation, under the crowns of<br />
studied urban trees this ratio was transformed to 67.8 % in<br />
winter and only 17.6 % in summer, on average (Table 3).<br />
This diffusing effect of the tree canopies results in<br />
higher values of transmissivity of total radiation (τ G) than<br />
of τ I, particularly in the case of foliated trees (Table 2).<br />
Average τ G through the studied trees ranged between<br />
8.4% and 14.5% for trees in leaf and from 48.0% to 59.0%<br />
in leafless conditions. These values are in good agreement<br />
with those reported in other studies conducted on<br />
single trees (de Abreu, Labaki 2008; Heisler 1986; Youngberg<br />
1983). However, several studies reported higher<br />
values of τ G in forests (about 20%), caused by the existence<br />
of gaps between trees and smaller canopy density<br />
in forests than in the case of single trees (Gay et al. 1971;<br />
Hardy et al. 2004; Oke 1987).<br />
Due to the heterogeneity of canopies, especially those<br />
of forests, representative measurement sampling is essential<br />
(e.g. Ni et al. 1997). Measurements presented here<br />
were conducted at one point under the canopy of each<br />
tree. However, since the measurements were continued<br />
for several hours, the direct solar beam was penetrating<br />
the crown at different angles. The relationship between<br />
sun altitude and the transmissivity of shortwave radiation<br />
through both foliated and defoliated canopies of all<br />
studied trees was found to be very weak (not shown).<br />
The foliated crowns of studied trees were found to be<br />
dense enough to block almost all direct radiation regardless<br />
of the length of the sun path through the tree. These<br />
results confirm that constant values of transmissivity can<br />
be used for modelling thermal comfort in areas shaded<br />
by vegetation at different solar zenith angles.<br />
The most favourable urban tree in temperate climates<br />
would be the one with the lowest transmissivity<br />
in summer, when the heat stress occurs, but highest<br />
in winter, when the sunshine is limited due to low sun<br />
altitude (Cantón et al. 1994). However, the dimensions<br />
and location of a tree also play a major role. At high latitudes<br />
the sun altitude in winter is low and trees located<br />
in street canyons or in courtyards can be shaded by adjacent<br />
buildings for the whole day. In such cases their<br />
Table 3. Mean ratio of direct (I h) to total (G) radiation<br />
above and below the canopies of trees.<br />
ISSUE NO. 46 DECEMBER 2012 INTERNATIONAL ASSOCIATION FOR URBAN CLIMATE<br />
Tree<br />
Defoliated<br />
Ref. (%) Tree (%)<br />
Foliated<br />
Ref. (%) Tree (%)<br />
Chestnut 86.5 68.4 89.9 11.3<br />
Linden 88.0 77.4 87.8 8.8<br />
Birch 82.8 61.6 75.8 16.2<br />
Cherry 84.6 64.0 86.1 24.0<br />
Pine N/A N/A 87.0 27.5<br />
low transmissivity does not contribute to the limitation<br />
of solar access, while in summer their shading effect<br />
can improve thermal comfort and decrease energy consumption<br />
for cooling.<br />
4. Conclusions<br />
Transmissivity of total and direct shortwave radiation<br />
through the crowns of single urban trees was measured<br />
on clear summer and winter days in the high latitude<br />
city of Göteborg, Sweden. Even though the studied trees<br />
differ in species, height and diameter, their crowns are<br />
characterised by a similar transmissivity of shortwave<br />
radiation. Dense, foliated crowns of single trees were almost<br />
impermeable for the solar radiation and only 1-5%<br />
of the incident direct beam reached the ground in their<br />
shadow. Transmissivity of total radiation was higher (average<br />
of 8-15% for different foliated trees) than of the<br />
direct component due to a high proportion of diffuse<br />
radiation in the tree shadow.<br />
In winter the transmissivity was also low – the leafless<br />
deciduous trees were found to block on average 40 to<br />
52% of the direct component and 48 to 59% of the total<br />
solar radiation. Such a low transmissivity of leafless trees<br />
is a disadvantage in high latitude cities, where the access<br />
to sunlight in winter is limited. Therefore, transmissivity<br />
of direct radiation and its seasonal variability should be<br />
taken into account in choosing the location and species<br />
of urban trees.<br />
The results of this study will be used for parameterization<br />
of SOLWEIG (Lindberg et al. 2008), a model simulating<br />
spatial distribution of shadow patterns, 3D radiation<br />
fluxes and the mean radiant temperature in complex<br />
urban settings.
<strong>Urban</strong> Projects 24<br />
Acknowledgments<br />
The project is being funded by the Swedish Research<br />
Council Formas, the Swedish Energy Agency, the Swedish<br />
Environmental Protection Agency, the Swedish National<br />
Heritage Board and the Swedish Transport Administration.<br />
References<br />
Akbari H., M. Pomerantz, and H. Taha, (2001). Cool surfaces<br />
and shade trees to reduce energy use and improve<br />
air quality in urban areas. Solar Energy, 70: p. 295-310.<br />
Cantón M. A., J. L. Cortegoso, and C. de Rosa, (1994).<br />
Solar permeability of urban trees in cities of western Argentina.<br />
Energy and Buildings, 20: p. 219-230.<br />
De Abreu L.V., and L. C. Labaki, (2008). 648: Evaluation<br />
of the radius of influence of different arboreal species on<br />
microclimate provided by vegetation. PLEA 2008 – 25th<br />
Conference on Passive and Low Energy Architecture, Dublin,<br />
22-24 Oct 2008.<br />
Gay L. W., K. R. Knoerr, and M. O. Braaten, (1971). Solar<br />
radiation variability on the floor of a pine plantation. Agr.<br />
Meteorol., 8: p. 39-60.<br />
Hardy J. P., Melloh R., Koenig G., Marks D., Winstral A.,<br />
Pomeroy J. W., and T. Link, (2004). Solar radiation transmission<br />
through conifer canopies. Agricultural and Forest<br />
Meteorology, 126: p. 257-270.<br />
Heisler G. M., (1986). Effects of individual trees on the<br />
solar radiation climate of small buildings. <strong>Urban</strong> Ecology,<br />
9: p. 337-359.<br />
Lindberg F., B. Holmer, and S. Thorsson, (2008). SOL-<br />
WEIG 1.0 – Modelling spatial variations of 3D radiant<br />
fluxes and mean radiant temperature in complex urban<br />
settings. International Journal of Biometeorology, 52: p.<br />
Janina Konarska 1<br />
janina.konarska@gvc.gu.se<br />
697–713.<br />
Fredrik Lindberg 1 , Annika Larsson 2 , Sofia Thorsson 1 , Björn Holmer 1<br />
1 Department of Earth Sciences, University of Gothenburg, Gothenburg, Sweden<br />
2 Faculty of Landscape Planning, Horticulture and Agricultural Science,<br />
Swedish University of Agricultural Science, Alnarp, Sweden<br />
Mayer H., and P. Hoppe, (1987). Thermal comfort of<br />
man in different urban environments. Theor. Appl. Clim.,<br />
38: p. 43-49.<br />
Mayer H., Kuppe S., Holst J., Imbery F. and A. Matzarakis,<br />
(2009). Human thermal comfort below the canopy of<br />
street trees on a typical Central European summer day.<br />
Ber. Meteor. Inst. Univ. Freiburg, 18: p. 211-219.<br />
Ni W., Li X., Woodcock C. E., Roujean J-L., and R. E.<br />
Davis, (1997). Transmission of solar radiation in boreal<br />
conifer forests: Measurements and models. Journal of<br />
Geophysical Research, 102: p. 29,555-29.566.<br />
Oke T. R., (1987). Boundary Layer <strong>Climate</strong>s. Methuen<br />
Press. London.<br />
Oke T. R., (1989). The Micrometeorology of the <strong>Urban</strong><br />
Forest. Phil. Trans. R. Soc. Lond. B., 324: p. 335-349.<br />
Pomeroy J. W. and K. Dion, (1996). Winter radiation<br />
extinction and reflection in a boreal pine canopy: Measurements<br />
and modelling. Hydrological Processes, 10: p.<br />
1591-1608.<br />
Shashua-Bar and M. E. Hoffman, (2000). Vegetation as<br />
a climatic component in the design of an urban street.<br />
Energy and Buildings, 31: p. 221-235<br />
Shashua-Bar L., Pearlmutter D. and E. Erell, (2011). The<br />
influence of trees and grass on outdoor thermal comfort<br />
in a hot-arid environment. Int. J. Climatol., 31: p. 1498-<br />
1506.<br />
Simpson J. R. and E. G. McPherson, (1996). Potential of<br />
tree shade for reducing residential energy use in California.<br />
Journal of Arboriculture, 22(1): p. 10-18.<br />
Youngberg R. J., (1983). Shading effects of deciduous<br />
trees. Journal of Arboriculture, 9(11): p. 295-297.<br />
ISSUE NO. 46 DECEMBER 2012 INTERNATIONAL ASSOCIATION FOR URBAN CLIMATE
<strong>Urban</strong> Projects 25<br />
Characteristics of the UHI in a high-altitude metropolitan city,<br />
Ulaanbaatar, Mongolia<br />
Introduction<br />
The urban heat island (UHI) is known as the higher<br />
near-surface air temperature in an urban area than in<br />
its surrounding rural area. Its causative factors are well<br />
known. These include anthropogenic heat, impervious<br />
surfaces, and three-dimensional urban geometry (Ryu<br />
and Baik 2012). Anthropogenic heat is an important causative<br />
factor, especially in the nighttime (Fan and Sailor<br />
2005). The sensible heat flux is larger and the latent heat<br />
flux is smaller in urban areas than in rural areas owing<br />
to the high heat storage capacity of urban surfaces and<br />
the low surface moisture availability of less vegetated<br />
urban surfaces. Relationships between meteorological<br />
parameters/weather conditions and UHI intensity are investigated<br />
in a number of studies (e.g., Unger 1996; Kim<br />
and Baik 2002). An ideal meteorological condition for<br />
UHI development is a stable, calm, and clear sky condition<br />
(Oke 1982). The UHI intensity depends on the time<br />
of day and the season. Strong UHI intensity more frequently<br />
appears in winter than in summer in many cities<br />
around the world (e.g., Figuerola and Mazzeo 1998; Liu<br />
et al. 2007). In this study, the characteristics of the UHI<br />
in Ulaanbaatar, the capital of Mongolia, are for the first<br />
time investigated.<br />
Study area and data<br />
Mongolia is situated in an area between permafrost<br />
to the north and desert lands to the south. Ulaanbaatar<br />
is the economic, social, political, cultural, and educational<br />
center of Mongolia. The city is located at an altitude of<br />
about 1350 m and in a valley. The area belongs to a cold<br />
semi-arid climate. Ulaanbaatar is known as the coldest<br />
capital city in the world because of its geographic features<br />
such as high altitude and landlocked location and<br />
the effects of the wintertime Siberian high. The monthly<br />
average temperature for each month from October to<br />
March is below 0°C, and the average temperature in<br />
winter is –19°C. The annual precipitation total is about<br />
270 mm, and most precipitation occurs in summer. The<br />
population of Ulaanbaatar reached 1.1 million (at the<br />
end of 2009), constituting 41% of the total population of<br />
Mongolia. The city area has almost doubled since 1974<br />
(Amarsaikhan et al. 2009).<br />
The UHI intensity is defined as the difference in air<br />
temperature at a height of 2 m between urban and rural<br />
stations. Ulaanbaatar station, located in a residential<br />
area that consists of ger-houses (traditional living houses<br />
known as yurts) and apartment buildings, represents an<br />
urban station. Buyant-Ukhaa airport station, located to<br />
the southwest of the city, represents a rural station. The<br />
altitudes of Ulaanbaatar and Buyant-Ukhaa stations are<br />
1306 and 1286 m, respectively. Data recorded at 3-h intervals<br />
from 1980 to 2010 are used in this study. Data are<br />
obtained from the State Archive and Database Center of<br />
the National Agency for Meteorology and Environmental<br />
Monitoring (NAMEM), Mongolia.<br />
Analysis of results<br />
The difference in annually averaged daily mean temperature<br />
between the two stations is 1.6°C for the period<br />
of 1980–2010. Figures 1a and 1b show the monthly<br />
and daily variation of the UHI intensity. The UHI intensity<br />
is strongest in winter (3.3°C) and weakest in summer<br />
(0.3°C). According to Ryu and Baik (2012), in the nighttime<br />
anthropogenic heat contributes greatly to the UHI<br />
intensity. In the nighttime, coal and wood burning in the<br />
traditional ger-houses for heating and cooking purposes<br />
Figure 1. (a) Monthly and (b) daily variation of the UHI intensity.<br />
ISSUE NO. 46 DECEMBER 2012 INTERNATIONAL ASSOCIATION FOR URBAN CLIMATE
<strong>Urban</strong> Projects 2<br />
Figure 2. (a) Annually and (b) seasonally averaged daily maximum UHI intensities.<br />
likely contributes to increasing temperature in the urban<br />
area, especially in cold months. As pointed out by Goldreich<br />
(1984), a stronger UHI intensity is expected in highaltitude<br />
cities associated with inevitable space heating<br />
demand under cold conditions. The UHI intensity is seen<br />
to be strongest at 0500 LST (2.9°C) and weakest at 1400<br />
LST (–0.2°C). In each season, the UHI is stronger in the<br />
nighttime than in the daytime (not shown).<br />
The average daily maximum UHI intensity for the period<br />
of 1980–2010 is 4.3°C. The annually averaged daily<br />
maximum UHI intensity exhibits an increasing trend (Fig.<br />
2a). The strongest daily maximum UHI intensity occurs in<br />
winter with an average intensity of 6.4°C, and the weakest<br />
daily maximum UHI intensity occurs in summer with<br />
an average intensity of 2.5°C (Fig. 2b). The average daily<br />
maximum UHI intensity is 3.8°C in spring and 4.5°C in autumn.<br />
Figure 3a shows the histogram of frequency distribution<br />
of the maximum UHI intensity. About 84% of the<br />
total frequency of the maximum UHI intensity exists in<br />
the range of 1–8°C. The most frequently observed maximum<br />
UHI intensity is 6°C. The occurrence frequency of<br />
the daily maximum UHI intensity in the nighttime is 5.6<br />
times larger than that in the daytime (Fig. 3b). This value<br />
is larger than the value for Seoul (3.3) (Kim and Baik<br />
2002).<br />
Following Kim and Baik (2002), a multiple linear regression<br />
analysis is performed to examine the relative<br />
importance of meteorological parameters that affect the<br />
daily maximum UHI intensity. Four meteorological parameters<br />
are considered: the maximum UHI intensity for<br />
the previous day (PER), wind speed (WS), cloudiness (CL),<br />
and relative humidity (RH). For all data, the multiple linear<br />
regression model explains half of the variance (49.8%).<br />
The stronger daily maximum UHI intensity is mostly led<br />
by stronger PER (Table 1). The second and third most important<br />
parameters are CL and WS, respectively, and are<br />
Table 1. Normalized regression coefficients of the<br />
four meteorological parameters (PER, maximum<br />
UHI intensity for the previous day; WS, wind speed;<br />
CL, cloudiness; RH, relative humidity). r 2 is the percentage<br />
of the total variance explained by the regression<br />
model, and n is the sample size.<br />
All Spring Summer Autumn Winter<br />
PER 0.48 0.30 0.20 0.41 0.32<br />
WS –0.14 –0.22 –0.14 –0.15 –0.05<br />
CL –0.34 –0.36 –0.44 –0.34 –0.26<br />
RH 0.03 –0.06 –0.18 –0.02 0.02<br />
r 2 49.8 33.4 33.4 38.1 18.5<br />
n 11272 2845 2847 2818 2762<br />
negatively correlated with the daily maximum UHI intensity.<br />
Magee et al. (1999) found that the increase in wind<br />
speed reduces the UHI intensity in Fairbanks and noted<br />
that the reason for the stronger UHI intensity under weak<br />
winds is because weak winds allow heat to accumulate<br />
near the surface without extensive mixing. In spring and<br />
summer, the most important parameter is CL and the<br />
second most important parameter is PER. In autumn and<br />
winter, PER is the most important parameter and CL is<br />
the second most important parameter.<br />
ISSUE NO. 46 DECEMBER 2012 INTERNATIONAL ASSOCIATION FOR URBAN CLIMATE
<strong>Urban</strong> Projects 27<br />
Figure 3. (a) Histogram of the frequency distribution (in fraction) of the daily maximum UHI intensity and (b)<br />
same as (a) except as a function of the time of day.<br />
Summary<br />
In this study, the characteristics of the Ulaanbaatar<br />
UHI were for the first time documented using surface<br />
meteorological data for the 31-year period of 1980–<br />
2010. The UHI features for Ulaanbaatar are qualitatively<br />
similar to UHI characteristics in many other cities around<br />
the world. The Ulaanbaatar UHI in winter, however, appears<br />
to be strong compared to the UHI in other cities<br />
(e.g., Seoul). We attribute this to the peculiar geographical<br />
features of Ulaanbaatar, wintertime weather that is<br />
strongly influenced by the Siberian high, and anthropogenic<br />
heat resulting from the burning of coal and wood.<br />
References<br />
Amarsaikhan, D., Ganzorig, M., Blotevogel, H. H., Nergui,<br />
B., and Gantuya, R. (2009) Integrated method to<br />
extract information from high and very high resolution<br />
RS images for urban planning. J Geogr Reg Plann , 2(10),<br />
258–267.<br />
Fan, H., and Sailor, D. J. (2005) Modeling the impacts<br />
of anthropogenic heating on the urban climate of Philadelphia:<br />
a comparison of implementations in two PBL<br />
1, 2<br />
Gantuya Ganbat<br />
gantuya@snu.ac.kr<br />
Ji-Young Han 3 , and Jong-Jin Baik 1<br />
1 School of Earth and Environmental Sciences, Seoul National University<br />
Seoul, South Korea<br />
2 Institute of Meteorology, Hydrology and Environment, Mongolia<br />
3 Korea Institute of Atmospheric Prediction Systems, Seoul, South Korea<br />
schemes. Atmos Environ, 39, 73–84.<br />
Figuerola, P. I., and Mazzeo, N. A. (1998) <strong>Urban</strong>-rural<br />
temperature differences in Buenos Aires. Int J Climatol,<br />
18, 1709–1723.<br />
Goldreich, Y. (1984) <strong>Urban</strong> topoclimatology. Prog<br />
Phys Geog, 8(3), 336–364.<br />
Kim, Y.-H., and Baik, J.-J. (2002) Maximum urban heat<br />
island intensity in Seoul. J Appl Meteor, 41, 651–659.<br />
Liu, W., Ji, C., Zhong, J., Jiang, X., and Zheng, Z. (2007)<br />
Temporal characteristics of the Beijing urban heat island.<br />
Theor Appl Climatol, 87, 213–221.<br />
Magee, N., Curtis, J., and Wendler, G. (1999) The urban<br />
heat island effect at Fairbanks, Alaska. Theor Appl Climatol,<br />
64, 39–47.<br />
Oke, T. R. (1982) The energetic basis of the urban heat<br />
island. Quart J Roy Meteorol Soc, 108, 1–24.<br />
Ryu, Y.-H., and Baik, J.-J. (2012) Quantitative analysis<br />
of factors contributing to urban heat island intensity. J<br />
Appl Meteor Climatol, 51, 842–854.<br />
Unger, J. (1996) Heat island intensity with different<br />
meteorological conditions in a medium-sized town:<br />
Szeged, Hungary. Theor Appl Climatol, 54, 147–151.<br />
ISSUE NO. 46 DECEMBER 2012 INTERNATIONAL ASSOCIATION FOR URBAN CLIMATE
<strong>Urban</strong> Projects 2<br />
Flux observations in London − Energy, water and carbon dioxide<br />
exchange in a dense European city centre<br />
The micrometeorology research group at King’s College<br />
London (KCL) is monitoring surface energy and<br />
carbon dioxide exchange in London, UK, since October<br />
2008. Greater London, a metropolitan area with over 8.2<br />
million inhabitants (2011 census, Office for National Statistics,<br />
2012), is situated in the southeast of the country<br />
(Figure 1). The climate of this region is temperate marine,<br />
with mid-latitude cyclones that cross the UK from<br />
East to West: the prevailing wind direction is from the<br />
southwest. Mean annual rainfall observed at a central<br />
London Met Office station (St James’s Park , Figure 1) accumulates<br />
to 570 mm and mean daily (24 h) temperatures<br />
range between 5-19°C, in January and July, respectively.<br />
Measurement sites are located in a dense urban<br />
setting, on top of buildings at the KCL Strand campus<br />
(51°30’ N, 0°7’ W), just north of River Thames (Figure 1).<br />
Loridan et al. (2013) classified the surrounding area as<br />
High Density UZE (<strong>Urban</strong> Zone for Energy partitioning,<br />
Loridan and Grimmond 2012). With 43% impervious<br />
Figure 1. Land cover map (based on OS MasterMap) with site locations of KCL Strand, Met Office stations and BT<br />
tower within the London Central Activity Zone (CAZ). Inlets show geographic location of CAZ within Greater London<br />
(bottom) and this within the UK (top). Figure based on Figure 1 in Kotthaus and Grimmond (in preparation).<br />
ISSUE NO. 46 DECEMBER 2012 INTERNATIONAL ASSOCIATION FOR URBAN CLIMATE
<strong>Urban</strong> Projects 29<br />
ground and 38% buildings, the surrounding surface cover<br />
is clearly dominated by anthropogenic materials. Due<br />
to the proximity to the River Thames, 14% of the surface<br />
is open water, leaving only about 5% to vegetation<br />
(grass and street trees). According to the image-based<br />
classification approach by Stewart and Oke (2012), the<br />
study area can be described as compact midrise LCZ 2<br />
(Local <strong>Climate</strong> Zone) with water (LCZ G).<br />
Two measurement towers are installed with a distance<br />
of about 60 m (Figure 2): observations at the KSK<br />
site (measurement height z m=39 m above ground or 1.9<br />
x mean building height z H) started in October 2008, while<br />
the KSS site (z m=49 m or 2.2 x z H) became operational<br />
in November 2009. The latter has been moved to the<br />
western end of the building in March 2012, here termed<br />
KSSW (z m=50.3 m or 2.3 x z H). At all three sites, radiation<br />
balance components are monitored (CNR1 and CNR4,<br />
Kipp & Zonen) alongside the turbulent surface fluxes of<br />
sensible and latent heat so that processes governing the<br />
surface energy balance can be investigated (Kotthaus<br />
and Grimmond, in preparation).<br />
The eddy covariance setup deployed here consists of<br />
a sonic anemometer (CSAT3, Campbell Sci.) and an infrared<br />
gas analyser (Li7500/Li7500A, LiCor Biosciences),<br />
which also enables monitoring of the turbulent flux of<br />
carbon dioxide. Besides the flux observations, a series of<br />
auxiliary data are collected including standard meteorological<br />
variables but also more specialised observations,<br />
e.g. cloud and aerosol conditions in the atmospheric<br />
boundary layer are monitored with a CL31 Ceilometer,<br />
Vaisala. The KCL London sites are part of the <strong>Urban</strong><br />
Flux Network (www.geog.ubc.ca/urbanflux) and have<br />
been presented in an article of the FLUXNET <strong>News</strong>letter<br />
dealing with eddy covariance measurements in the urban<br />
environment (Kotthaus et al. 2012). Kotthaus et al.<br />
(2012) put the KCL observations, collected at the dense<br />
urban KSS site, in context to surface fluxes observed in<br />
the town of Swindon, a typical South England suburban<br />
area located 120 km west of London. A detailed study of<br />
surface exchange mechanisms in Swindon is presented<br />
by Ward et al. (2012).<br />
Within the last decade, eddy covariance observations<br />
have become more established in the urban environment<br />
to measure surface fluxes (Grimmond 2006). However,<br />
the heterogeneous, three-dimensional surface<br />
structure and the occurrence of emission sources at various<br />
heights within the urban canopy create a profoundly<br />
complex subject of study. Kotthaus and Grimmond<br />
(2012) address the impact of anthropogenic emissions<br />
on eddy covariance observations by developing a new<br />
procedure for the Identification of Micro-scale Anthropogenic<br />
Sources (IMAS). At the KSS site, several sources<br />
for heat, moisture and carbon dioxide are located above<br />
the mean building height and in close vicinity of the<br />
Figure 2. Aerial photo (NERC ARSF) of KCL Strand campus<br />
with eddy covariance flux tower locations. The star<br />
marks the location of a chimney near KSS, a significant<br />
source of anthropogenic emissions of heat, water and<br />
carbon dioxide. (See text and Figure 1 for details).<br />
tower. Under certain conditions, these are found to significantly<br />
influence the observations, usually leading to<br />
an increase of the respective turbulent flux. The detected<br />
micro-scale signals are too extreme to be associated<br />
with blended emissions from the site’s local scale source<br />
area but rather originate from chimneys and exhaust<br />
pipes in the immediate surroundings of the tower.<br />
An automatic filtering techniques is presented (Kotthaus<br />
and Grimmond 2012) to identify micro-scale anthropogenic<br />
emissions in the high-frequency (10 Hz)<br />
time series of sonic temperature, water vapour and carbon<br />
dioxide. All variables are filtered together, based on<br />
a series of tailored criteria (developed by Kotthaus and<br />
Grimmond 2012, and updated by Kotthaus and Grimmond,<br />
in preparation). It is used to extract the microscale<br />
effects so that turbulent fluxes can be estimated<br />
which are representative at the local scale. Kotthaus and<br />
Grimmond (2012) present a detailed evaluation of the<br />
method. Amongst others, independent measurements<br />
are incorporated which confirm the strong impact of micro-scale<br />
emission sources, also fluxes are analysed by<br />
wind direction in order to put the observations into context<br />
to the locations of the emission sources. A chimney<br />
in the East of KSS (star in Figure 2) represents the strongest<br />
source so that fluxes calculated using common eddy<br />
covariance processing are significantly affected under<br />
easterly wind conditions. The flux of carbon dioxide for<br />
example shows a strong increase of its high quantiles in<br />
the easterly sector (Figure 3a).<br />
The new IMAS procedure automatically identifies time<br />
ISSUE NO. 46 DECEMBER 2012 INTERNATIONAL ASSOCIATION FOR URBAN CLIMATE
<strong>Urban</strong> Projects 30<br />
Figure 3. Observations at KSS (11/2009-03/2012): (a) quantiles of carbon dioxide flux F CO2 by wind direction in<br />
10° intervals; (b) micro-scale anthropogenic carbon dioxide flux representative of the building scale, by wind<br />
direction and time of day, calculated as the difference between commonly processed turbulent flux (L1) and<br />
results incorporating the IMAS filter (L2). See Kotthaus and Grimmond (2012) for further details: plots are based<br />
on their Figure 8 and Figure 11; eddy covariance flux processing and IMAS filter as outlined by Kotthaus and<br />
Grimmond (in preparation).<br />
periods affected by the close-by anthropogenic sources<br />
based exclusively on the raw time series, i.e. not taking<br />
into account aspects such as wind direction. However,<br />
the filter mainly picks up events under easterly flow conditions<br />
which suggests it to be suitable for its purpose.<br />
The filter is incorporated into the flux processing procedure<br />
so that results can be obtained which are representative<br />
of the respective local scale source area. In order<br />
to investigate the impact of the micro-scale effects, the<br />
fluxes are calculated as usual (L1 processing, see Kotthaus<br />
and Grimmond 2012 for details) and including the<br />
IMAS procedure (L2 processing). The difference between<br />
these results provides a first order estimate of the anthropogenic<br />
(heat or carbon dioxide) flux at the building<br />
scale. The distribution by wind direction of this microscale<br />
turbulent flux estimate (L1-L2, e.g. for carbon dioxide<br />
flux F CO2 , Figure 3b), again emphasizes the directional<br />
dependence of the flux estimates on the locations of the<br />
main emission source at KSS (to the East). Figure 3b further<br />
shows variations of micro-scale fluxes by time of day<br />
(radial axis), with generally larger values recorded during<br />
daytime. This is in agreement with the time of usage of<br />
the building generating the emissions, which is located<br />
in the central business district where the daytime population<br />
far exceeds the one at night. With respect to the<br />
order of magnitude, building scale fluxes of sensible and<br />
latent heat or carbon dioxide observed at KSS show reasonable<br />
agreement with modelling approaches. These<br />
are usually employed to estimates anthropogenic con-<br />
tributions to the surface energy balance (e.g. Iamarino et<br />
al. 2012) and the carbon dioxide budget. The presented<br />
filtering technique depicts the first attempt to directly<br />
measure these fluxes, which are especially important in<br />
high density urban environments.<br />
Flux processing at KCL incorporates an updated version<br />
of the IMAS procedure, so that turbulent surface<br />
exchange can be interpreted based on the local scale<br />
source area (Kotthaus and Grimmond, in preparation).<br />
Given the dense urban setting of the KCL Strand campus<br />
(Figure 1), anthropogenic effects are also clearly evident<br />
at this larger scale (as opposed to the building scale<br />
flux shown in Figure 3b). Median diurnal patterns of energy<br />
fluxes observed at KSS in summer (JJA) and winter<br />
(DJF) reveal how energy exchange is affected in central<br />
London (Figure 4). Naturally, energy input from the net<br />
all-wave radiation Q* is significantly higher in summer,<br />
while its contribution to the surface energy balance is<br />
rather small during times of low sun elevation. Turbulent<br />
sensible heat flux Q H is also weaker during winter, however<br />
its median diurnal maximum of about 100 W m -2 distinctly<br />
exceeds the radiation flux (~65 W m -2 ). And even<br />
more notably, night time sensible heat flux accounts for<br />
strong upward energy transport of over 50 W m -2 with<br />
even higher median values during summer. Significant<br />
storage heat flux is characteristic for dense urban environments<br />
and provides energy for the turbulent fluxes<br />
in times of no radiative input. A few other measurement<br />
studies with sites locates in the city centre (e.g. Basel,<br />
ISSUE NO. 46 DECEMBER 2012 INTERNATIONAL ASSOCIATION FOR URBAN CLIMATE
<strong>Urban</strong> Projects 31<br />
Christen and Vogt 2004) have reported conditions maintaining<br />
positive Q H during the whole night. Additionally<br />
to the heat storage of the urban surface, further anthropogenic<br />
contributions to this strong nocturnal sensible<br />
heat flux can be expected from direct building and vehicle<br />
emissions. Despite the vicinity to the River Thames<br />
(Figure 1), moisture availability in the dense urban environment<br />
is restricted under many flow conditions so<br />
that Q H dominates over the turbulent latent heat flux Q E.<br />
The long-term operation of the central London sites allows<br />
for the analysis of temporal and spatial variations<br />
of surface energy exchange in a dense European city<br />
centre which will be presented shortly by Kotthaus and<br />
Grimmond (in preparation).<br />
Acknowledgements<br />
Support was provided by the EU FP7 BRIDGE (grant<br />
agreement no. 211345), NERC grant ClearfLo (NE/<br />
H003231/1 01/01/10) and NERC ARSF (GB08/19). We<br />
thank Arnold Moene at Wageningen University for providing<br />
the ECpack software and advice; Fredrik Lindberg<br />
for land cover data analysis; all those at KCL who contributed<br />
to the data collection.<br />
References<br />
Christen, A., and R. Vogt, 2004: Energy and Radiation Balance<br />
of a Central European City. Int. J. Climatol., 24, 1395–<br />
1421.<br />
Grimmond, C. S. B., 2006: Progress in Measuring and Observing<br />
the <strong>Urban</strong> Atmosphere. Theor. Appl. Climatol., 84,<br />
3–22.<br />
Iamarino, M., S. Beevers, and C. S. B. Grimmond, 2012:<br />
High-resolution (space, time) anthropogenic heat emissions:<br />
London 1970-2025. Int. J. Climatol., 32, 1754–1767,<br />
doi:10.1002/joc.2390.<br />
Kotthaus, S., and C. S. B. Grimmond, Energy exchange in<br />
a dense urban environment – long-term energy flux observations<br />
in central London. In preparation.<br />
Kotthaus, S., and C. S. B. Grimmond, 2012: Identification<br />
of Micro-scale Anthropogenic CO2, heat and moisture<br />
sources – Processing eddy covariance fluxes for a dense urban<br />
environment. Atmos. Environ., 57, 301–316, doi:10.1016/<br />
j.atmosenv.2012.04.024.<br />
Kotthaus, S., H. C. Ward, C. S. B. Grimmond, and J. G. Evans,<br />
2012: <strong>Urban</strong> Flux Measurements in Southern England,<br />
by KCL and CEH. Fluxletter, The FLUXNET <strong>News</strong>letter, 5, 25–<br />
31.<br />
Loridan, T., and C. S. B. Grimmond, 2012: Characterization<br />
of Energy Flux Partitioning in <strong>Urban</strong> Environments: Links<br />
with Surface Seasonal Properties. J. Appl. Meteor. Climatol.,<br />
51, 219–241, doi:10.1175/JAMC-D-11-038.1.<br />
Loridan, T., F. Lindberg, O. Jorba, S. Kotthaus, S. Grossman-Clarke,<br />
and C. S. B. Grimmond, 2013: High resolution<br />
simulation of the variability of surface energy balance fluxes<br />
Figure 4. Median diurnal patterns (shading marks interquartile<br />
range) observed at KSS (11/2009-03/2012) in<br />
summer (JJA) and winter (DJF): net all-wave radiation<br />
Q*, turbulent flux of sensible heat Q H and turbulent flux<br />
of latent heat Q E. Figure is based on Figure 5 in Kotthaus<br />
et al. (2012), however data presented here cover a longer<br />
time period and are calculated using an updated<br />
version of the IMAS processing (Kotthaus and Grimmond,<br />
in preparation).<br />
across central London with <strong>Urban</strong> Zones for Energy partitioning.<br />
Bound. Lay. Met., doi:10.1007/s10546-013-9797-y.<br />
Stewart, I. D., and T. R. Oke, 2012: “Local <strong>Climate</strong> Zones”<br />
for urban temperature studies. Bull. Amer. Meteor. Soc.,<br />
120525055949004, doi:10.1175/BAMS-D-11-00019.1.<br />
Ward, H. C., J. G. E. Evans, and C. S. B. Grimmond, 2012:<br />
ACPD - Abstract - Multi-season eddy covariance observations<br />
of energy, water and carbon fluxes over a suburban area in<br />
Swindon, UK. Atmos. Chem. Phys. Discuss., 12, 29147–29201.<br />
Simone Kotthaus<br />
simone.kotthaus@kcl.ac.uk<br />
Sue Grimmond<br />
King’s College London (KCL)<br />
London, UK<br />
ISSUE NO. 46 DECEMBER 2012 INTERNATIONAL ASSOCIATION FOR URBAN CLIMATE
<strong>Urban</strong> Projects 32<br />
On the road to a universal equation for the UHI<br />
Within the urban climate community, the urban heat<br />
island (UHI) effect, here defined as the difference in temperature<br />
between the urban and rural environment at<br />
the pedestrian level, is a longstanding research topic.<br />
The UHI causes adverse effects for human thermal comfort,<br />
urban energy consumption, and urban air quality.<br />
While the UHI has been regarded of significant importance,<br />
simple models for estimating the UHI intensity<br />
within urban areas are still lacking (Arnfield, 2003). In<br />
addition, computer power to run global weather prediction<br />
models is increasing. Yet this is not enough to<br />
couple the global models to relatively complex urban<br />
energy balance parameterizations. In order to produce<br />
accurate temperature predictions for urban areas it can<br />
be beneficial to have a simple method to forecast the<br />
UHI as an operational tool.<br />
Despite several attempts to derive a uniform formula<br />
for the UHI, the complexity of the system so far has inhibited<br />
this. Considering the amount of factors that govern<br />
the UHI, this is no wonder. In general, we can distinguish<br />
between urban and rural governing factors. The UHI<br />
magnitude depends not only on urban properties such<br />
as areal green and water cover, street geometry (aspect<br />
ratio) and thermal properties of building materials, but<br />
also on wind speed and direction, incoming radiation,<br />
cloud cover, urban soil moisture, season and the location<br />
of the city itself (e.g. elevation, latitude, etc.). The<br />
geographical location of the city also includes properties<br />
of its rural surroundings, i.e. whether it is a forest,<br />
grassland, desert, or any other land use type. Of course,<br />
many more factors affect the UHI magnitude. Possibly<br />
too many factors are involved to capture the UHI in one<br />
model and the dependencies are unique for each city or<br />
town. Hence, combining all these variables poses a great<br />
challenge. Oke (1998) made a first attempt to combine<br />
known relations between the UHI and some of these<br />
variables (street geometry, cloud cover and wind). This<br />
resulted in a simple model for the diurnal cycle of the<br />
UHI.<br />
We will attempt to approach this problem from a<br />
different angle. Within atmospheric boundary-layer research,<br />
dimensional analysis (e.g. Langhaar, 1951) is a<br />
widely used method to tackle these kinds of complex<br />
systems. A well-known example of this approach is Monin-Obukhov<br />
similarity theory (Monin and Obukhov,<br />
1954). This theory relates the shape of the vertical profiles<br />
of wind speed and temperature to the turbulent<br />
fluxes of momentum and heat within the atmospheric<br />
surface layer. In this study we use dimensional analysis<br />
in search of a uniform equation for the UHI. However,<br />
due to the amount of variables influencing the UHI, the<br />
problem would be mathematically too complex to solve.<br />
Therefore, selecting the most important variables is the<br />
first step of our approach. The variables will be selected<br />
using the statistical principle component analysis method,<br />
a way of identifying patterns and data reduction. Using<br />
this analysis we are able to find the variables which<br />
are most important in influencing the UHI magnitude.<br />
On this compressed dataset the dimensional analysis<br />
will be performed.<br />
About dimensional analysis<br />
Dimensional analysis is a method to estimate the dependence<br />
of one variable, in this case the UHI, on other<br />
variables, e.g. clouds, wind speed, vegetation in the city,<br />
soil moisture, etc. The analysis can be carried out using<br />
three steps.<br />
1. Selecting variables<br />
First, all quantities that affect the studied variable<br />
need to be selected. As mentioned before, the amount<br />
of variables influencing the key variable can make for a<br />
complicated mathematical problem. Therefore, we use<br />
a principle component analysis and limit the amount of<br />
variables.<br />
2. Define dimensionless groups<br />
Once the right quantities have been selected, one can<br />
derive dimensionless groups. Depending on the amount<br />
of selected variables (m) and their basic S.I. dimensions<br />
(n), the number of dimensionless groups (r) to be made<br />
is m-n=r. For example, if we consider six variables with<br />
a total of 3 basic dimensions, such as temperature (K),<br />
length (m), time (s), etc., 3 dimensionless groups can<br />
be made (6-3 = 3). The dimensionless groups should be<br />
unique.<br />
3. Use data to determine a universal function between dimensionless<br />
groups<br />
Once the dimensionless groups have been defined,<br />
the mutual dependencies between the dimensionless<br />
groups have to be quantified. In order to do so, an experimental<br />
dataset is needed, either from observations,<br />
or model output. With this dataset, the dimensionless<br />
groups are plotted as a function of each other. Consequently,<br />
we derive an equation describing the functional<br />
relation between the dimensionless groups, i.e. by a<br />
suitable regression analysis method. Finally, rewriting<br />
this equation will provide an expression for the studied<br />
variable, i.e. UHI. As the number of variables increases,<br />
the number of dimensionless groups increases as well,<br />
and it becomes more complex to fit an equation through<br />
all the groups.<br />
ISSUE NO. 46 DECEMBER 2012 INTERNATIONAL ASSOCIATION FOR URBAN CLIMATE
<strong>Urban</strong> Projects 33<br />
Figure 1. A schematic overview of the variables taken into account with the dimensional analysis.<br />
Application to the UHI<br />
We illustrate the described procedure for the UHI, using<br />
preliminary results obtained from output of the Weather<br />
Research and Forecasting (WRF) model (Skamarock et al.,<br />
2008) in single column mode, version 3.2.1. The model is<br />
coupled to the single-layer urban canopy model (Kusaka<br />
et al., 2001). As a reference for the UHI, a second column<br />
was run separately with surface properties of grassland.<br />
This column represents the rural environment. The MYJ<br />
planetary boundary-layer scheme was used.<br />
The analyzed case has an academic setup, initialized<br />
with idealized profiles and large-scale forcings, i.e. with a<br />
uniform mixed layer temperature and specific humidity,<br />
a logarithmic wind speed profile, a temperature and humidity<br />
jump at the boundary-layer top, and a constant<br />
lapse rate above the boundary layer. This case was run<br />
while varying soil moisture content, geostrophic wind<br />
speed, vegetation fraction, anthropogenic heat flux,<br />
building heat capacity and thermal conductivity, season<br />
and latitude.<br />
For example, six variables were selected from the<br />
WRF simulations to enter the dimensional analysis.<br />
These were the UHI [K] (in this case the difference in<br />
the minimum two meter air temperature between the<br />
urban and rural simulation), vegetation fraction (f veg[-]),<br />
the maximum downwelling shortwave radiation (S max<br />
[W m -2 ]), the maximum difference in ground heat/storage<br />
flux between the urban and rural simulations (∆G max<br />
[W m -2 ]), the lapse rate in the rural environment during<br />
the night (dθ/dz [K m -1 ]) and the stable boundary-layer<br />
height (H SBL[m]) (Fig. 1). Using these variables we are able<br />
create three dimensionless groups. The first group (∏ 1)<br />
is a function of the vegetation fraction, which has often<br />
shown to be a strong governing parameter of the UHI<br />
(e.g. Steeneveld et al., 2011).<br />
∏ 1 = 1/(1+ f veg) (1)<br />
The physical rationale behind applying a transformed<br />
version of f veg rather than f veg itself, is to ensure well behaved<br />
limiting behavior of ∏ 1 for f veg-> 0.<br />
The second group (2) is the ratio of the absolute maxima<br />
of the two fluxes (shortwave and storage fluxes) and<br />
relates to the amount of energy stored within the buildings<br />
and pavement.<br />
∏ 2 = ∆G max/S max (2)<br />
The rationale behind this group is based on the idea<br />
that that the difference in heat storage capacity of the<br />
offered solar radiation by the land surface will be reflected<br />
in different cooling and cooling rates at night, and<br />
thus in the UHI.<br />
The third group (3) includes the remaining variables,<br />
(UHI, stable boundary-layer height and lapse rate) and<br />
gives an indication of the stability of the atmospheric<br />
boundary layer.<br />
ISSUE NO. 46 DECEMBER 2012 INTERNATIONAL ASSOCIATION FOR URBAN CLIMATE
∏ 3 = UHI<br />
(∂θ/∂z)H SBL<br />
<strong>Urban</strong> Projects 34<br />
This group is introduced in order to represent the<br />
state of the boundary layer in the rural surroundings.<br />
A stronger stability will limit the turbulent transport of<br />
relatively warm air from aloft to the surface, and thus<br />
maximizing the UHI. Note that the two variables in the<br />
denominator are connected, since a stronger stability<br />
will reduce H SBL due to the suppressed turbulence.<br />
Plotting these dimensionless groups as a function of<br />
each other, an approximately linear relation appears and<br />
an equation for the UHI can be formulated. This equation<br />
for the UHI is compared to the UHI calculated by the<br />
WRF model in Figure 2. Half of the dataset was used to<br />
derive the equation and the other half for validation. The<br />
derived model has a correlation coefficient to the one to<br />
one line of about 0.78.<br />
The simple dimensional analysis described above<br />
gives a promising, preliminary result. However, these<br />
findings are only based on WRF model results, which has<br />
its own limitations. Furthermore, this is only one example<br />
with a limited dataset. In order to find whether or not<br />
there is a uniform equation for the UHI, a much larger<br />
dataset is needed, including field observations from different<br />
cities around the globe. Therefore, possible cooperation<br />
and contributions from field campaigns from the<br />
audience of <strong>Urban</strong> <strong>Climate</strong> <strong>News</strong> are highly welcomed<br />
and appreciated.<br />
Acknowledgements<br />
The author acknowledges helpful discussions about<br />
the studied topic with Gert-Jan Steeneveld, Bert Holtslag,<br />
Reinder Ronda, Sue Grimmond and Tim Oke. The<br />
NWO project Sustainable Accessibility to the Randstad<br />
sponsored this study.<br />
References<br />
Arnfield, A. J., 2003. Two decades of urban climate<br />
research: A review of turbulence, exchanges of energy<br />
and water, and the urban heat island. Int. J. Climatol., 23,<br />
1–26.<br />
Kusaka H, Kondo H, Kikegawa Y, Kimura F. 2001. A<br />
simple singlelayer urban canopy model for atmospheric<br />
models: Comparison with multi-layer and slab models.<br />
Boundary-Layer Meteorology 101: 329– 358.<br />
Langhaar, H.L., 1951. Dimensional Analysis and Theory<br />
of Models, Wiley, New York, 166p.<br />
Monin, A. S. and Obukhov, A. M.: 1954. ‘Osnovnye zakonomernosti<br />
turbulentnogo peremeshivanija v prizemnom<br />
sloe atmosfery (Basic Laws of Turbulent Mixing in<br />
the Atmosphere Near the Ground)’, Trudy Geofiz. Inst. AN<br />
SSSR 24(151), 163–187.<br />
Oke TR. 1998. An algorithmic scheme to estimate<br />
(3)<br />
Figure 2. A scatter plot of the predicted UHI by the<br />
equation calculated using dimensional analysis and<br />
the UHI calculated by the WRF model. (r 2 = 0.78)<br />
hourly heat island magnitude. In Preprints, 2nd <strong>Urban</strong><br />
Environment Symposium. American Meteorological Society:<br />
Boston; 80–83.<br />
Skamarock W, Klemp J, Dudhia J, Gill D, Barker D,<br />
Duda M, HuangXY,WangW, Powers J. 2008. A description<br />
of the advanced research WRF version 3. NCAR Technical<br />
Note, NCAR.<br />
Steeneveld, G.J., S. Koopmans, B.G. Heusinkveld, L.W.A.<br />
van Hove, and A.A.M. Holtslag, 2011: Quantifying urban<br />
heat island effects and human comfort for cities of variable<br />
size and urban morphology in The Netherlands, J.<br />
Geophys. Res., 116, D20129, doi:10.1029/2011JD015988.<br />
Natalie Theeuwes<br />
Natalie.Theeuwes@wur.nl<br />
Meteorology and Air Quality Section, Wageningen<br />
University, Wageningen, Netherlands<br />
ISSUE NO. 46 DECEMBER 2012 INTERNATIONAL ASSOCIATION FOR URBAN CLIMATE
Special Report<br />
Announcing the Student Award Winners from the th International<br />
Conference on <strong>Urban</strong> <strong>Climate</strong> (ICUC ) in Dublin<br />
The IAUC has announced the names of 13 student<br />
award winners who were recognized for work they presented<br />
in August 2012 at the Eighth International Conference<br />
on <strong>Urban</strong> <strong>Climate</strong> (ICUC ) in Dublin, Ireland.<br />
Each of these PhD students has been awarded a $200<br />
prize, with funding coming from the Board of the <strong>Urban</strong><br />
Environment of the American Meteorological Society,<br />
the WMO, the EPA and SFI in Ireland, and the family of<br />
William P. Lowry, who was an important contributor to<br />
the field of urban climatology.<br />
This edition of <strong>Urban</strong> <strong>Climate</strong> <strong>News</strong> includes articles by<br />
recipients of the IAUC and Lowry awards (see pages 7-<br />
34), and the work of AMS award winners will appear in<br />
the March2013 issue.<br />
Jonas Alegrini<br />
Empa Dübendorf,<br />
Switzerland<br />
AMS Student Award<br />
The urban microclimate has a significant influence<br />
on the energy demand for space cooling and heating in<br />
buildings. The radiative heat gains are increased due to<br />
multiple reflections of longwave and solar radiation between<br />
the buildings. The convective heat transfer at the<br />
building façades is decreased, because the wind speeds<br />
are decreased in urban areas. Further, the air temperatures<br />
are, due to the urban heat island effect, increased<br />
in urban compared to rural areas. All three effects lead<br />
to a higher space cooling demand for buildings in urban<br />
areas. This study shows the importance of accounting<br />
for the local urban microclimate, when predicting the<br />
energy demands for buildings in urban areas.<br />
Ifeoluwa Adebowale Balogun<br />
Federal University Of Technology,<br />
Akure, Nigeria<br />
Lowry Student Award for Africa<br />
I am a lecturer at the Department of Meteorology,<br />
School of Earth and Mineral Sciences, Federal University<br />
of Technology, Akure, Nigeria. I am an applied meteorologist<br />
with expertise in micrometeorology, urban climate,<br />
ISSUE NO. 46 DECEMBER 2012 INTERNATIONAL ASSOCIATION FOR URBAN CLIMATE<br />
35<br />
biometeorology, and climate change. I have specific interest<br />
in monitoring, assessing and quantifying urban<br />
impacts and associated landuse landcover changes on<br />
local climate, air quality and inhabitants’ comfort. I have<br />
participated in several micrometeorology and urban climate<br />
field experiments in Nigeria. My current research<br />
involves understanding the role of cities in modifying<br />
the weather, climate and air quality, and also suggesting<br />
how such research may be usefully employed at various<br />
scales of urban management by architects, environmentalists,<br />
urban planners, and decision and policy makers.<br />
The research also involves mitigation measures that can<br />
be applied to combat climate change impacts.<br />
I have authored or co-authored several publications<br />
on these issues in reputable journals. Several more manuscripts<br />
are currently in preparation.<br />
Research Summary - <strong>Urban</strong>isation with its attendant<br />
landuse and landcover changes (LULCC) has been affirmed<br />
to produce significant changes in surface and atmospheric<br />
properties that can result in inadvertent local<br />
weather and climate changes. In view of this, Akure (Lat:<br />
7.25 °N; Lon: 5.20 °E), a medium sized rapidly developing<br />
tropical city in south-western Nigeria, has been investigated.<br />
Incidentally, the city ranks among the Millennium<br />
Cities initiative project of the Columbia University and<br />
Columbia national investment working with the Millennium<br />
Developmental Goals (MDG) support team of the<br />
United Nations Development Program (UNDP). A network<br />
of in situ measuring stations were set up for two<br />
years (January, 2009 - December, 2010) at seventeen different<br />
locations within the city with each landuse type<br />
fairly represented.<br />
Understanding the extent of change in the transition<br />
of various land use types within the city metropolis is<br />
very important. Multi-temporal remote sensing data and<br />
GIS techniques were used to detect landuse landcover<br />
changes and analyse the urban expansion through different<br />
classification schemes, and the associated climatic<br />
responses were further investigated. Results shows<br />
the consequential modifications of the city growth on<br />
the local climate as the relationship between the urban<br />
and rural parameters indicates the significance of local<br />
effects. <strong>Urban</strong>ization effects on local temperature and<br />
humidity have been shown to be significant in the city.<br />
Values of cooling degree days obtained to estimate<br />
how much cooling energy may be needed for inhabitants’<br />
comfort revealed that elevated temperatures in the<br />
central urban areas at both day and night will increase<br />
the potential for cooling of buildings. Existing bioclimat-
Special Report<br />
ic indices were used to derive the bioclimatic conditions<br />
of the urban city centre and a rural reference site. Results<br />
showed that higher frequencies of urban induced high<br />
temperatures observed in the city centre suggest a significant<br />
heat stress and health risk in this hot humid environment.<br />
The aspects of heat islands and their relation to urban<br />
geometry functions such as the sky view factor (SVF)<br />
were further investigated. A clear linear relationship between<br />
the sky view factor and UHI intensity is obtained,<br />
which is an indication that street geometry and its regional<br />
distribution within the city play a fundamental<br />
role in generating differential air temperature patterns.<br />
Also, intra-urban variations of temperature are also<br />
shown to be influenced by land use and other site factors.<br />
The highlights of the cooling effects of the vigorous<br />
evapotranspiration of the city trees during both the dry<br />
and wet seasons, and the potential of trees as a cost effective<br />
UHI and climate change impact mitigation tool<br />
in Akure have been established in the study.<br />
The project has provided a better scientific understanding<br />
of urban climate characteristics arising from<br />
anthropogenic activities in Akure. Results obtained can<br />
help facilitate measures that can be applied to mitigate<br />
climatological degradation, and to design alternate<br />
measures to sustain or improve the overall Akure urban<br />
environment in the future. The proceeds from the work<br />
will be a good toolkit for urban and town planners, architects,<br />
environmental managers and other decision/<br />
policy makers.<br />
Benjamin Bechtel<br />
KlimaCampus, University of<br />
Hamburg, Germany<br />
IAUC Student Award<br />
Benjamin Bechtel was born in Heidelberg, Germany.<br />
He studied geography, physics, computer science and<br />
urban planning at the University of Hamburg, the Hamburg<br />
University of Applied Sciences, and the Hamburg<br />
University of Technology. He is currently finalising his<br />
PhD and working as a research associate in the Cluster of<br />
Excellence CliSAP at the KlimaCampus in Hamburg.<br />
His research interests are in the fields of urban climatology<br />
and urban remote sensing, in particular the characterization<br />
of urban surfaces for applications in urban<br />
climatology and the provision and integration of urban<br />
surface parameters. For his PhD thesis with the title “Remote<br />
sensing of urban canopy parameters for enhanced<br />
modelling and climate related classification of urban<br />
ISSUE NO. 46 DECEMBER 2012 INTERNATIONAL ASSOCIATION FOR URBAN CLIMATE<br />
3<br />
structures” he developed and tested new surface parameters<br />
and methods to classify local climate zones from<br />
remotely sensed data. Further, he used floristic proxy<br />
data to derive a long-term urban heat island pattern and<br />
compare a large number of surface parameters as empirical<br />
predictors. In a subsequent study he showed that<br />
the novel parameters are also beneficial for downscaling<br />
of coarse resolution land surface temperatures from<br />
geostationary satellites in urban areas. His overall aim is<br />
to strengthen the bridge between urban remote sensing<br />
and urban climatology by finding new applications and<br />
interfaces.<br />
Mr. Bechtel is a member of the International Association<br />
for <strong>Urban</strong> <strong>Climate</strong>, the European Geosciences Union,<br />
and the German Society for Photogrammetry, Remote<br />
Sensing and Geoinformation. He acts as a reviewer for<br />
several international journals including Meteorologische<br />
Zeitschrift, IEEE Transactions on Geoscience and Remote<br />
Sensing, and Landscape and <strong>Urban</strong> Planning.<br />
Cécile de Munck<br />
Meteo France - CNRS,<br />
France<br />
AMS Student Award<br />
“Green roofs for cities: modelling within TEB” − The<br />
need to prepare cities for climate change adaptation<br />
requests the urban modeller community to implement<br />
within their models sustainable adaptation strategies to<br />
be tested against specific city morphologies and scenarios.<br />
Greening city roofs is part of these strategies.<br />
In this context, a GREENROOF module for the Town<br />
Energy Balance (TEB) model has been developed to<br />
model the interactions between buildings and green<br />
roof systems at the scale of the city. This module, consisting<br />
in the coupling of the TEB and the ISBA-DF (Diffusive<br />
version of the Interaction between Soil Biosphere and<br />
Atmosphere) models, allows to describe an extensive<br />
green roof composed of four functional compartments<br />
(vegetation - grasses or sedums, substrate, hydrological<br />
control layer, and artificial layers) and to model fluxes<br />
of heat, water and momentum between the vegetation<br />
and the atmosphere, as well as water and thermal fluxes<br />
throughout the natural layers of the green roof and the<br />
thermal coupling with the structural building envelope.<br />
A calibration exercise of GREENROOF, focusing on hydrological<br />
characteristics, has been carried out at building-scale<br />
for an extensive sedum green roof, which is the<br />
most frequently type of green roof implemented in cities.
Special Report<br />
The methodology consisted in running 864 versions of<br />
GREENROOF calibrated with different sets of realistic hydrological<br />
characteristics in order to identify on the basis<br />
of statistical scores the calibration set providing the best<br />
match with observations. GREENROOF proved capable<br />
of well reproducing the dynamics and amplitude of the<br />
substrate moisture status while performing well in simulating<br />
the temperatures of all the layers. Consequently,<br />
the hydrological calibration identified for the standard<br />
green roof of the case study will be retained as the default<br />
calibration to model green roofs at city-scale.<br />
Gantuya Ganbat<br />
Seoul National University,<br />
South Korea<br />
IAUC Student Award<br />
“Characteristics of the UHI in a high-altitude metropolitan<br />
city, Ulaanbaatar, Mongolia” − Ulaanbaatar<br />
is the capital city of Mongolia with a population of 1.1<br />
million and is located at about 1350 m above sea level.<br />
This study documents for the first time the characteristics<br />
of the urban heat island (UHI) in Ulaanbaatar. Data<br />
at two meteorological stations, an urban site and a rural<br />
site, for a 31-year period of 1980–2010 are used for UHI<br />
analysis. The average UHI intensity is 1.6°C. The UHI intensity<br />
is strongest in winter (3.3°C) and weakest in summer<br />
(0.3°C). The occurrence frequency of the daily maximum<br />
UHI intensity in the nighttime is 5.6 times larger than that<br />
in the daytime. A multiple linear regression analysis is undertaken<br />
to examine the relative importance of meteorological<br />
parameters (previous-day maximum UHI intensity,<br />
wind speed, cloudiness, and relative humidity) that<br />
affect the daily maximum UHI intensity. The previous-day<br />
maximum UHI intensity is the most important parameter<br />
and is positively correlated with the daily maximum UHI<br />
intensity. The cloudiness is the second most important<br />
parameter and is negatively correlated with the daily<br />
maximum UHI intensity. When all data are stratified into<br />
daytime/nighttime and season, the relative importance<br />
of the meteorological parameters is changed.<br />
Janina Konarska<br />
University of Gothenburg,<br />
Sweden<br />
Lowry Student Award for Biometeorology<br />
Janina Konarska is a second year PhD student within<br />
the Göteborg <strong>Urban</strong> <strong>Climate</strong> Group at University of Go-<br />
ISSUE NO. 46 DECEMBER 2012 INTERNATIONAL ASSOCIATION FOR URBAN CLIMATE<br />
37<br />
thenburg, Sweden. Her current research focuses on the<br />
influence of various types of vegetation on different<br />
aspects of the urban climate. She has been measuring<br />
transmissivity of solar radiation through the crowns of<br />
trees, mean radiant temperature, nocturnal cooling rates<br />
and tree transpiration.<br />
Simone Kotthaus<br />
Kings College London,<br />
UK<br />
IAUC Student Award<br />
Since 2009 I have been part of the Micrometeorological<br />
research group of Prof. Sue Grimmond at King’s College<br />
London (KCL), UK. Currently, I am in the final stages<br />
of my PhD. My work combines both modelling and measurement<br />
approaches to observe the exchange of sensible<br />
heat in urban areas.<br />
While the main focus of my research lies on the application<br />
of the eddy covariance (EC) method in dense<br />
urban settings, I am also working with (surface and atmospheric)<br />
remote sensing techniques.<br />
Scott Krayenhoff<br />
University Of British Columbia,<br />
Canada<br />
AMS Student Award<br />
My research seeks to better understand the processes<br />
responsible for the unique surface climates that result<br />
from urban development. To date I have studied surfaceatmosphere<br />
exchange and urban canopy layer processes<br />
via the development, evaluation and application of<br />
numerical models. In the present work a new multi-layer<br />
urban canopy model of shortwave and longwave radiation<br />
exchange is developed that explicitly includes the<br />
radiative effects of tall vegetation (trees).<br />
Tree foliage is permitted both between and above<br />
buildings, and mutual shading and reflection between<br />
buildings and trees are included. The model is designed<br />
to be portable to any neighbourhood-scale urban canopy<br />
model based on the urban canyon. The new radiation<br />
model will help extend the applicability of neighbourhood-scale<br />
urban climate models and permit more<br />
robust assessment of trees as a tool to improve urban<br />
microclimates.
Special Report<br />
Kevin Lau<br />
The Chinese University Of Hong<br />
Kong, China<br />
AMS Student Award<br />
Due to the limited history of district-scale meteorological<br />
stations, the study of the effect of urbanization<br />
on local climate has been restricted to territory-scale<br />
(i.e. taking Hong Kong as a whole). It results in a lack of<br />
understanding of district-scale climatic variability as sufficient<br />
observational records are limited. The study aims<br />
to supplement the understanding of the effect of urbanization<br />
on district-scale variations in air temperature by<br />
using an extended record of air temperature between<br />
1971 and 2010. Warming trends are generally observed<br />
and the rate of warming is particularly observed in rural<br />
stations. Such a trend is associated with land conversion<br />
into concrete surface in surrounding areas and reduction<br />
in vegetation cover. Findings of the present study<br />
contribute to the understanding of the effect of climate<br />
change on areas with various land use and provide baseline<br />
conditions for temperature projection of future climate<br />
change scenarios. Such information will be useful<br />
to the incorporation of microclimatic conditions into the<br />
planning and design of potential development in country<br />
areas and redevelopment of inner urban areas in the<br />
future.<br />
Natalie E. Theeuwes<br />
Wageningen University,<br />
Netherlands<br />
Lowry Student Award for Methodology<br />
“Towards a new formula for the urban heat island using<br />
dimensional analysis” − This research aims to study<br />
the urban heat island intensity and its causes. Many<br />
variables affect the urban heat island, such as incoming<br />
solar radiation, wind speed, clouds, available vegetation,<br />
building thermal properties, anthropogenic heat<br />
production, etc. First a statistical analysis is performed<br />
to identify the most important variables governing the<br />
urban heat island using observational data from different<br />
cities in the world and idealised WRF model results.<br />
By applying the dimensional analysis technique, a wellknown<br />
tool in boundary-layer meteorology, on the key<br />
parameters identified, we aim to reveal a universal equation<br />
for the urban heat island.<br />
Patrick Wagner<br />
University of Duisburg-Essen,<br />
Germany<br />
AMS Student Award<br />
ISSUE NO. 46 DECEMBER 2012 INTERNATIONAL ASSOCIATION FOR URBAN CLIMATE<br />
3<br />
To form ozone in the troposphere two types of precursor<br />
substances are needed: NOx (nitrogen oxides)<br />
and VOCs (volatile organic compounds). Whereas NOx<br />
are mainly emitted by anthropogenic sources, for VOCs<br />
there are considerable biogenic emissions. It is wellknown<br />
that in rural areas BVOCs (biogenic VOCs) are the<br />
dominant VOC type, but there is still little knowledge<br />
about their importance in urban areas and only a few<br />
studies were performed to investigate this issue worldwide.<br />
Because there are high anthropogenic VOC (AVOC)<br />
emissions and vegetation density is much lower in comparison<br />
to rural areas, the importance of BVOCs might<br />
be underestimated in urban environments. However,<br />
BVOCs are more reactive than AVOCs and BVOC emissions<br />
reach their maximum during hot and sunny summer<br />
days which are also favorable for ozone formation.<br />
Moreover, some popular urban tree species are so-called<br />
high-emitters for BVOCs, especially isoprene which is the<br />
most abundant BVOC.<br />
To investigate the aforementioned issue, concentrations<br />
of isoprene, benzene and toluene were measured<br />
with a GC-PID system in Essen, Germany. Spatial and<br />
temporal variations of VOC concentrations were investigated<br />
and isoprene concentration was compared to<br />
concentration of benzene and toluene (which are popular<br />
proxys for AVOCs), especially in the summer. It was<br />
found that isoprene concentration exceeds the concentration<br />
of benzene and toluene during daylight hours<br />
on hot summer days. Isoprene/benzene concentration<br />
ratio can reach values above ten in vicinity of isoprene<br />
emitting trees (e.g. Platanus acerifolia, Quercus robur,<br />
Quercus rubra, Robinia pseudoacacia and Populus nigra).<br />
These measurement results indicate that BVOCs have to<br />
be considered with regard to ozone formation not only<br />
in rural, but also in urban areas.<br />
Jaime Young<br />
Tel Aviv University,<br />
Israel / MIT, US<br />
AMS Student Award<br />
My presentation, entitled “Climatic planning according<br />
to Vitruvius and its application in the Holy Land”
Special Report<br />
came out of a collaboration between MIT and Tel Aviv<br />
University, supported by MIT’s International Science and<br />
Technology Initiative. I worked with Oded Potchter in<br />
the Lab for <strong>Climate</strong> and Environment at Tel Aviv University,<br />
researching and preparing an article that we hope<br />
soon to publish. Our research delved into the theory and<br />
practice of design and planning according to climatic<br />
conditions in ancient times. We looked at ancient texts<br />
regarding architecture, urban design, and city planning,<br />
then compared these with the physical remains of city<br />
plans and public buildings. We chose to focus for this<br />
project specifically on Vitruvius’ writings and cities that<br />
were built during the Roman Empire.<br />
Abstract: Roman civilization is known for its plethora<br />
of large-scale planning projects and monumental architecture.<br />
Architects and planners used the resources<br />
available to them to create pleasant thermal conditions<br />
in public places without the use of high-tech climate<br />
control systems. Passive techniques were employed for<br />
lighting, shading, and ventilation based on the wisdom<br />
of generations and knowledge of local conditions. The<br />
Roman architect Vitruvius produced the first recorded<br />
guidelines for climatic planning of cities and design of<br />
public buildings. This study examines the application<br />
of these principles in the Holy Land as it is rich in architectural<br />
remains from the Roman and Byzantine era and<br />
has great variety in its climatic zones. The research was<br />
carried out using archaeological evidence of town plans<br />
and floor plans of monumental structures, specifically<br />
January 9, 2013<br />
Dear Colleagues,<br />
ISSUE NO. 46 DECEMBER 2012 INTERNATIONAL ASSOCIATION FOR URBAN CLIMATE<br />
39<br />
theaters, baths, and basilicas. Each plan was evaluated<br />
based on geographic location and adherence to Vitruvian<br />
principles. The research yields findings in the way<br />
design followed the recommendations, but was altered<br />
when local environmental and climatic considerations<br />
necessitated a different model. Patterns were found that<br />
provide understanding of the climatic design theory. In<br />
analyzing the designs’ response to climate, inspiration<br />
can be drawn from the attitude of the ancients that harmonized<br />
the constructed with the natural.<br />
Yuan Chao<br />
The Chinese University of Hong<br />
Kong, China<br />
AMS Student Award<br />
High-density living makes cities more efficient in the<br />
use of natural resources. However, it also causes serious<br />
urban environmental problems. To efficiently mitigate<br />
the negative effects of compact living, apart from<br />
modeling the environment, it is also important to relate<br />
the modeling with planning and design issues. My work<br />
aims to allow urban planners and architects practical scientific<br />
understandings to improve the high-density urban<br />
living environment.<br />
It is with great sadness that we inform you that our friend and colleague, Henrique Andrade,<br />
passed away yesterday at the age of 52. Henrique’s passing is a great loss for the University of<br />
Lisbon and especially for the Institute of Geography and Spatial Planning, where he was Assistant<br />
Professor, and the Centre of Geographical Studies, where he was member of the board and<br />
researcher at the research group on climate and environmental changes.<br />
Henrique’s academic career developed at the University of Lisbon. He graduated in Geography<br />
in 1990. His master’s degree in Physical Geography was obtained in 1994, focusing on<br />
atmospheric pollutants in Lisbon and his PhD was obtained in 2004 on human bioclimatology and air temperatures, a<br />
topic where he was a pioneer in Portugal. His recent research targeted the societal impacts of climate in cities, including<br />
climate change: a) urban green areas and well-being, b) climate and health (mainly on the effects of heat and cold<br />
waves), c) climate change and tourism. He was supervising PhD students on these topics and currently was working<br />
on mortality and cold events in Central Portugal and also on the effects of lightning on the number of asthma cases in<br />
children, through a collaboration with the D. Estefânia Hospital. He was responsible for the mesoscale urban climate<br />
network of Lisbon. He has recently published in journals such as the International Journal of Biometeorology, Building and<br />
Environment, Landscape and <strong>Urban</strong> Planning, Theoretical and Applied Climatology, International Journal of Biometeorology<br />
and Finisterra. He was author or co-author of several papers in international books. Henrique was low profile but very<br />
active and continuously searched for new research lines and funding sources. He will be greatly missed by friends and<br />
colleagues. His research legacy is very significant and will be continued by colleagues and students at IGOT/CEG-UL.<br />
Colleagues from teams CliMA and ANTECC at CEG-UL<br />
Centre for Geographical Studies, Institute of Geography and Spatial Planning, University of Lisbon (http://clima.ul.pt)
Bibliography<br />
Recent publications in <strong>Urban</strong><br />
Climatology<br />
Al-Kofahi, S.; Steele, C.; VanLeeuwen, D. & Hilaire, R. S.<br />
(2012), Mapping land cover in urban residential landscapes<br />
using very high spatial resolution aerial photographs,<br />
<strong>Urban</strong> Forestry & <strong>Urban</strong> Greening 11(3), 291 - 301.<br />
Ali, K.; Budhavant, K.; Safai, P. & Rao, P. (2012), Seasonal<br />
factors influencing in chemical composition of total suspended<br />
particles at Pune, India, Science of The Total Environment<br />
414(0), 257 - 267.<br />
Andrey Sogachev, M. K. & Leclerc, M. Y. (2012), Consistent<br />
Two-Equation Closure Modelling for Atmospheric<br />
Research: Buoyancy and Vegetation Implementations,<br />
Boundary-Layer Meteorology 145, 307-327.<br />
Armson, D.; Stringer, P. & Ennos, A. (2012), The effect of<br />
tree shade and grass on surface and globe temperatures<br />
in an urban area, <strong>Urban</strong> Forestry & <strong>Urban</strong> Greening 11(3),<br />
245 - 255.<br />
Arruti, A.; Fernandez-Olmo, I. & Irabien, A. (2012), Evaluation<br />
of the urban/rural particle-bound PAH and PCB levels<br />
in the northern Spain (Cantabria region), Environmental<br />
Monitoring and Assessment 184(11), 6513--6526.<br />
B. Gioli, P. Toscano, et al. (2012), Methane and carbon dioxide<br />
fluxes and source partitioning in urban areas: The<br />
case study of Florence, Italy, Environmental Pollution 164,<br />
125 -131.<br />
B. L. Barnhart, W. E. Eichinger, J. H. P. (2012), A New Eddy-<br />
Covariance Method Using Empirical Mode Decomposition,<br />
Boundary-Layer Meteorology 145, 369-382.<br />
Baik, J. J.; Kwak, K. H.; Park, S. B. & Ryu, Y. H. (2012), Effects<br />
of building roof greening on air quality in street canyons,<br />
Atmospheric Environment 61, 48-55.<br />
Baldauf, R. W.; Heist, D.; Isakov, V.; Perry, S.; Hagler, G. S.;<br />
Kimbrough, S.; Shores, R.; Black, K. & Brixey, L. (2013), Air<br />
quality variability near a highway in a complex urban environment,<br />
Atmospheric Environment 64(0), 169--178.<br />
Bonanno, G.; Lo Giudice, R. & Pavone, P. (2012), Trace element<br />
biomonitoring using mosses in urban areas affected<br />
by mud volcanoes around Mt. Etna. The case of the<br />
Salinelle, Italy, Environmental Monitoring and Assessment<br />
184(8), 5181--5188.<br />
Brandsma, T. & Wolters, D. (2012), Measurement and Statistical<br />
Modeling of the <strong>Urban</strong> Heat Island of the City of<br />
Utrecht (the Netherlands), Journal of Applied Meteorology<br />
and Climatology 51(6), 1046-1060.<br />
Bresson, E.; Ducrocq, V.; Nuissier, O.; Ricard, D. & de Saint-<br />
Aubin, C. (2012), Idealized numerical simulations of quasi-stationary<br />
convective systems over the Northwestern<br />
Mediterranean complex terrain, Quarterly Journal of the<br />
Royal Meteorological Society 138(668), 1751--1763.<br />
Since the last newsletter, not only the coordinator<br />
of the Bibliographic Committee has<br />
changed, but also some new members volunteered<br />
to strengthen the Bib-Com. Team. In this<br />
IAUC <strong>News</strong>letter I would like to introduce our 6<br />
new motivated members: Hendrik Wouters (KU<br />
Leuven/VITO, Belgium), Kathrin Haeb (University<br />
of Kaiserslautern, Germany), Rafiq Hamdi<br />
(RMI, Belgium), Ashley Broadbent (Monash<br />
University, Melbourne, Australia), Julien Le Bras<br />
(Meteo France, France) and Bharathi Boppana<br />
(University of Southampton, U.K.). Welcome!<br />
At the same time I would warmly like to thank<br />
Grégoire Pigeon, Erell Evyatar and Anurag<br />
Kandya for their contribution to this Committee<br />
over the last few years!<br />
In this edition a list of publications are presented<br />
that have come out until the end of November<br />
2012. As usual, papers published since<br />
this date are welcome for inclusion in the next<br />
newsletter and IAUC online database. Please<br />
send your references to the email address below<br />
with a header “IAUC publications” and the following<br />
format: Author, Title, Journal, Volume, Pages,<br />
Dates, Keywords, Language, URL, and Abstract.<br />
Enjoy!<br />
Matthias Demuzere<br />
Department of Earth and<br />
Environmental Sciences,<br />
KU Leuven, Belgium<br />
matthias.demuzere@ees.kuleuven.be<br />
ISSUE NO. 46 DECEMBER 2012 INTERNATIONAL ASSOCIATION FOR URBAN CLIMATE<br />
40<br />
Browning, K. A.; Marsham, J. H.; White, B. A. & Nicol, J. C.<br />
(2012), A case study of a large patch of billows surmounted<br />
by elevated convection, Quarterly Journal of the Royal<br />
Meteorological Society 138(668), 1764--1773.<br />
Bruce, B. H.; William, J. C.; William R Pendergrass, I., I.; Ronald,<br />
J. D. & Novakovskaia, E. (2012), <strong>Urban</strong> Turbulence in<br />
Space and in Time, Journal of Applied Meteorology and Climatology<br />
51(2), 205-218.<br />
Brummer, B.; Lange, I. & Konow, H. (2012), Atmospheric<br />
boundary layer measurements at the 280 m high Hamburg<br />
weather mast 19952011: mean annual and diurnal<br />
cycles, Meteorologische Zeitschrift 21(4), 319-335.<br />
Buccolieri, R. & Sabatino, S. D. (2011), MUST experiment<br />
simulations using CFD and integral models, Int. J. of Envi-
Bibliography<br />
ronment and Pollution 44(1/2/3/4), 376 - 384.<br />
Bueno, B.; Pigeon, G.; Norford, L. K.; Zibouche, K. &<br />
Marchadier, C. (2012), Development and evaluation of<br />
a building energy model integrated in the TEB scheme,<br />
Geoscientific Model Development 5(2), 433--448.<br />
Burcham, D. C.; Leong, E.-C. & Fong, Y.-K. (2012), Passive<br />
infrared camera measurements demonstrate modest effect<br />
of mechanically induced internal voids on Dracaena<br />
fragrans stem temperature, <strong>Urban</strong> Forestry & <strong>Urban</strong> Greening<br />
11(2), 169 - 178.<br />
Butler, T. M.; Stock, Z. S.; Russo, M. R.; Denier van der Gon,<br />
H. A. C. & Lawrence, M. G. (2012), Megacity ozone air quality<br />
under four alternative future scenarios, Atmospheric<br />
Chemistry and Physics 12(10), 4413--4428.<br />
C. G. Helmis, G. Sgouros, M. T. K. S. C. M. E. B. A. D. (2012),<br />
A Comparative Study and Evaluation of Mixing-Height<br />
Estimation Based on Sodar-RASS, Ceilometer Data and<br />
Numerical Model Simulations, Boundary-Layer Meteorology<br />
145, 507-526.<br />
Cameron, R. W.; Blanuša, T.; Taylor, J. E.; Salisbury, A.; Halstead,<br />
A. J.; Henricot, B. & Thompson, K. (2012), The domestic<br />
garden and Its contribution to urban green infrastructure,<br />
<strong>Urban</strong> Forestry & <strong>Urban</strong> Greening 11(2), 129<br />
- 137.<br />
Capps, S. L.; Henze, D. K.; Hakami, A.; Russell, A. G. & Nenes,<br />
A. (2012), ANISORROPIA: the adjoint of the aerosol<br />
thermodynamic model ISORROPIA, Atmospheric Chemistry<br />
and Physics 12(1), 527--543.<br />
Cavalcante, R. M.; Sousa, F. W.; Nascimento, R. F.; Silveira,<br />
E. R. & Viana, R. B. (2012), Influence of urban activities on<br />
polycyclic aromatic hydrocarbons in precipitation: Distribution,<br />
sources and depositional flux in a developing metropolis,<br />
Fortaleza, Brazil, Science of The Total Environment<br />
414(0), 287 - 292.<br />
Chau, C. K.; Pun-Cheng, L. S. C.; Ng, W. Y. & Hui, W. K. (2012),<br />
Study of the PM10 concentration variations along two<br />
intra-urban roads within a compact city, Environmental<br />
Monitoring and Assessment 184(6), 3943--3958.<br />
Chaudhari, P. R.; Gupta, R.; Gajghate, D. G. & Wate, S. R.<br />
(2012), Heavy metal pollution of ambient air in Nagpur<br />
City, Environmental Monitoring and Assessment 184(4),<br />
2487--2496.<br />
Chelani, A. B. (2012), Persistence analysis of extreme CO,<br />
NO2 and O3 concentrations in ambient air of Delhi, Atmospheric<br />
Research 108(0), 128 - 134.<br />
Chen, F. & Coauthors (2012), Research Priorities in Observing<br />
and Modeling <strong>Urban</strong> Weather and <strong>Climate</strong>, Bulletin of<br />
the American Meteorological Society 93, 1725-1728.<br />
Chen, L.-W. A.; Watson, J. G.; Chow, J. C.; Green, M. C.; Inouye,<br />
D. & Dick, K. (2012), Wintertime particulate pollution<br />
episodes in an urban valley of the Western US: a case<br />
ISSUE NO. 46 DECEMBER 2012 INTERNATIONAL ASSOCIATION FOR URBAN CLIMATE<br />
41<br />
study, Atmospheric Chemistry and Physics 12(21), 10051-<br />
10064.<br />
Cheng, Y. F.; Su, H.; Rose, D.; Gunthe, S. S.; Berghof, M.;<br />
Wehner, B.; Achtert, P.; Nowak, A.; Takegawa, N.; Kondo, Y.;<br />
Shiraiwa, M.; Gong, Y. G.; Shao, M.; Hu, M.; Zhu, T.; Zhang,<br />
Y. H.; Carmichael, G. R.; Wiedensohler, A.; Andreae, M. O. &<br />
Pцschl, U. (2012), Size-resolved measurement of the mixing<br />
state of soot in the megacity Beijing, China: diurnal<br />
cycle, aging and parameterization, Atmospheric Chemistry<br />
and Physics 12(10), 4477--4491.<br />
Cheung, H. C.; Morawska, L.; Ristovski, Z. D. & Wainwright,<br />
D. (2012), Influence of medium range transport of particles<br />
from nucleation burst on particle number concentration<br />
within the urban airshed, Atmospheric Chemistry and<br />
Physics 12(11), 4951--4962.<br />
Christopher, P. L.; Dale, J. A.; Zhang, D.-L.; Kenneth, E. P.;<br />
Russell, R. D. & Landry, L. (2012), Roles of <strong>Urban</strong> Tree Canopy<br />
and Buildings in <strong>Urban</strong> Heat Island Effects: Parameterization<br />
and Preliminary Results, Journal of Applied Meteorology<br />
and Climatology 51(10), 1775-1793.<br />
Claus, K. & Rousseau, S. (2012), Public versus private incentives<br />
to invest in green roofs: A cost benefit analysis<br />
for Flanders, <strong>Urban</strong> Forestry & <strong>Urban</strong> Greening 11(4), 417<br />
- 425.<br />
Conejos, S.; Langston, C. & Smith, J. (2013), AdaptSTAR<br />
model: A climate-friendly strategy to promote built environment<br />
sustainability, Habitat International 37, 95-103.<br />
Corona, P.; Agrimi, M.; Baffetta, F.; Barbati, A.; Chiriaco,<br />
M. V.; Fattorini, L.; Pompei, E.; Valentini, R. & Mattioli, W.<br />
(2012), Extending large-scale forest inventories to assess<br />
urban forests, Environmental Monitoring and Assessment<br />
184(3), 1409--1422.<br />
Dai, W.; Ho, S. S. H.; Ho, K.; Liu, W.; Cao, J. & Lee, S. (2012),<br />
Seasonal and diurnal variations of mono- and di-carbonyls<br />
in Xian, China, Atmospheric Research 113(0), 102 - 112.<br />
DUAN Chunfeng, MIAO Qilong, CAO Wen & MA Deli<br />
(2012), Effect of <strong>Urban</strong>ization on Variation Trends of Air<br />
Temperatures Based on Mountain Stations, Chinese Journal<br />
of Atmospheric Sciences, 811-822.<br />
Duan, J.; Guo, S.; Tan, J.; Wang, S. & Chai, F. (2012), Characteristics<br />
of atmospheric carbonyls during haze days in<br />
Beijing, China, Atmospheric Research 114-115(0), 17 - 27.<br />
Early, J. J. (2012), The forces of inertial oscillations, Quarterly<br />
Journal of the Royal Meteorological Society 138(668),<br />
1914--1922.<br />
Evan, M. O.; Richard, B. R.; Zhang, K.; Carina, J. G.; Marie, S.<br />
O.; Jalonne, L. W.; Shannon, J. B. & Daniel, G. B. (2012), An<br />
Investigation into the Spatial Variability of Near-Surface<br />
Air Temperatures in the Detroit, Michigan, Metropolitan<br />
Region, Journal of Applied Meteorology and Climatology<br />
51(7), 1290-1304.
Bibliography<br />
Ferrari, U.; Exner, T.; Wanka, E. R.; Bergemann, C.; Meyerarnek,<br />
J.; Hildenbrand, B.; Tufman, A.; Heumann, C.; Huber,<br />
R. M.; Bittner, M. & Fischer, R. (2012), Influence of air<br />
pressure, humidity, solar radiation, temperature, and<br />
wind speed on ambulatory visits due to chronic obstructive<br />
pulmonary disease in Bavaria, Germany, International<br />
Journal of Biometeorology 56(1), 137-43.<br />
Ferro, C. A. T. & Fricker, T. E. (2012), A bias-corrected decomposition<br />
of the Brier score, Quarterly Journal of the<br />
Royal Meteorological Society 138(668), 1954--1960.<br />
Foreman, R. J. & Emeis, S. (2012), A Method for Increasing<br />
the Turbulent Kinetic Energy in the Mellor–Yamada–Janji?<br />
Boundary-Layer Parametrization, Boundary-Layer Meteorology<br />
145, 329-349.<br />
Franke, J.; Hellsten, A.; Schlunzen, K. H. & Carissimo, B.<br />
(2011), The COST 732 Best Practice Guideline for CFD simulation<br />
of flows in the urban environment: a summary,<br />
Int. J. of Environment and Pollution 44(1/2/3/4), 419 - 427.<br />
Ganguly, R. & Broderick, B. M. (2011), Application of urban<br />
street canyon models for predicting vehicular pollution<br />
in an urban area in Dublin, Ireland, Int. J. of Environment<br />
and Pollution 44(1/2/3/4), 71-77.<br />
Gordon, M.; Ralf, M. S.; Liggio, J.; Makar, P.; Li, S.-M.; Wentzell,<br />
J.; Lu, G.; Lee, P. & Jeffrey, R. B. (2012), Measurements<br />
of Enhanced Turbulent Mixing near Highways, Journal of<br />
Applied Meteorology and Climatology 51(9), 1618-1632.<br />
Goricsan, I.; Balczo, M.; Balogh, M.; Czader, K.; Rakai, A. &<br />
Tonko, C. (2011), Simulation of flow in an idealised city using<br />
various CFD codes, Int. J. of Environment and Pollution<br />
44(1/2/3/4), 359 - 367.<br />
Greis, T.; Helmholz, K.; Schoeniger, H. M. & Haarstrick, A.<br />
(2012), Modelling of spatial contaminant probabilities<br />
of occurrence of chlorinated hydrocarbons in an urban<br />
aquifer, Environmental Monitoring and Assessment 184(6),<br />
3577--3591.<br />
Gross, G. (2012), Numerical simulation of greening effects<br />
for idealised roofs with regional climate forcing, Meteorologische<br />
Zeitschrift 21(2), 173-181.<br />
Gross, G. (2012), Effects of different vegetation on temperature<br />
in an urban building environment. Micro-scale<br />
numerical experiments, Meteorologische Zeitschrift 21(4),<br />
399-412.<br />
Guitart, D.; Pickering, C. & Byrne, J. (2012), Past results and<br />
future directions in urban community gardens research,<br />
<strong>Urban</strong> Forestry & <strong>Urban</strong> Greening 11(4), 364 - 373.<br />
GUO Yunqian, YUAN Renmin, LUO Tao, SUN Jianning & JI-<br />
ANG Weimei (2012), Research on Relationships between<br />
High-Speed Coherent Structure and Turbulence Flux, Chinese<br />
Journal of Atmospheric Sciences, 733-743.<br />
Hagedorn, R.; Buizza, R.; Hamill, T. M.; Leutbecher, M. &<br />
Palmer, T. N. (2012), Comparing TIGGE multimodel fore-<br />
ISSUE NO. 46 DECEMBER 2012 INTERNATIONAL ASSOCIATION FOR URBAN CLIMATE<br />
42<br />
casts with reforecast-calibrated ECMWF ensemble forecasts,<br />
Quarterly Journal of the Royal Meteorological Society<br />
138(668), 1814--1827.<br />
Hartz, D. A.; Golden, J. S.; Sister, C.; Chuang, W.-c. & Brazel,<br />
A. J. (2012), <strong>Climate</strong> and heat-related emergencies in Chicago,<br />
Illinois (2003-2006), International Journal of Biometeorology<br />
56(1), 71-83.<br />
Hauru, K.; Niemi, A. & Lehvävirta, S. (2012), Spatial distribution<br />
of saplings in heavily worn urban forests: Implications<br />
for regeneration and management, <strong>Urban</strong> Forestry &<br />
<strong>Urban</strong> Greening 11(3), 279 - 289.<br />
He, K.; Zhao, Q.; Ma, Y.; Duan, F.; Yang, F.; Shi, Z. & Chen,<br />
G. (2012), Spatial and seasonal variability of PM2.5 acidity<br />
at two Chinese megacities: insights into the formation of<br />
secondary inorganic aerosols, Atmospheric Chemistry and<br />
Physics 12(3), 1377--1395.<br />
He, X.; Wei, Y.; Cheng, L.; Zhang, D. & Wang, Z. (2012), Molecular<br />
detection of three gastroenteritis viruses in urban<br />
surface waters in Beijing and correlation with levels of fecal<br />
indicator bacteria, Environmental Monitoring and Assessment<br />
184(9), 5563--5570.<br />
Healy, R. M.; Sciare, J.; Poulain, L.; Kamili, K.; Merkel, M.;<br />
Müller, T.; Wiedensohler, A.; Eckhardt, S.; Stohl, A.; Sarda-<br />
Estиve, R.; McGillicuddy, E.; OConnor, I. P.; Sodeau, J. R. &<br />
Wenger, J. C. (2012), Sources and mixing state of size-resolved<br />
elemental carbon particles in a European megacity:<br />
Paris, Atmospheric Chemistry and Physics 12(4), 1681--<br />
1700.<br />
Hens, L. (2010), Book Review: Adapting Cities to <strong>Climate</strong><br />
Change - Understanding and Addressing the Development<br />
Challenges, by Jane Bicknell, David Dodman and<br />
David Satterthwaite, Int. J. of Environment and Pollution<br />
43(4), 385 - 386.<br />
Hernandez, H. & Rodriguez, R. (2012), Geochemical evidence<br />
for the origin of vanadium in an urban environment,<br />
Environmental Monitoring and Assessment 184(9),<br />
5327--5342.<br />
Herrmann, J. & Matzarakis, A. (2012), Mean radiant temperature<br />
in idealised urban canyons–examples from<br />
Freiburg, Germany, International Journal of Biometeorology<br />
56(1), 199-203.<br />
Hill, P. G.; Hogan, R. J.; Manners, J. & Petch, J. C. (2012), Parametrizing<br />
the horizontal inhomogeneity of ice water<br />
content using CloudSat data products, Quarterly Journal<br />
of the Royal Meteorological Society 138(668), 1784--1793.<br />
Holloway, C. E.; Woolnough, S. J. & Lister, G. M. S. (2012),<br />
Precipitation distributions for explicit versus parametrized<br />
convection in a large-domain high-resolution tropical<br />
case study, Quarterly Journal of the Royal Meteorological<br />
Society 138(668), 1692--1708.<br />
HOU Ling & YAO Zhanyu (2012), Air Pollution Index and
Bibliography<br />
Precipitation Weekly Circulation Characteristics and Its<br />
Possible Influencing Mechanism Analysis over Beijing<br />
and Its Adjacent Regions, Chinese Journal of Atmospheric<br />
Sciences, 686-696.<br />
Hu, Z.; Shi, Y.; Niu, H. & Cai, Y. (2012), Synthetic musk fragrances<br />
and heavy metals in snow samples of Beijing<br />
urban area, China, Atmospheric Research 104-105(0), 302<br />
- 305.<br />
Huang, X.-F.; Chen, D.-L.; Lan, Z.-J.; Feng, N.; He, L.-Y.; Yu, G.-<br />
H. & Luan, S.-J. (2012), Characterization of organic aerosol<br />
in fine particles in a mega-city of South China: Molecular<br />
composition, seasonal variation, and size distribution, Atmospheric<br />
Research 114-115(0), 28 - 37.<br />
Iqbal, S.; Wasim, M.; Tufail, M.; Arif, M. & Chaudhry, M. M.<br />
(2012), Elemental contamination in urban parks of Rawalpindi/Islamabad-a<br />
source identification and pollution<br />
level assessment study, Environmental Monitoring and Assessment<br />
184(9), 5497--5510.<br />
Ishikawa, N. & Fukushige, M. (2012), Effects of street landscape<br />
planting and urban public parks on dwelling environment<br />
evaluation in Japan, <strong>Urban</strong> Forestry & <strong>Urban</strong><br />
Greening 11(4), 390 - 395.<br />
Islam, M. N.; Rahman, K.-S.; Bahar, M. M.; Habib, M. A.;<br />
Ando, K. & Hattori, N. (2012), Pollution attenuation by<br />
roadside greenbelt in and around urban areas, <strong>Urban</strong> Forestry<br />
& <strong>Urban</strong> Greening 11(4), 460 - 464.<br />
Jansson, M. & Lindgren, T. (2012), A review of the concept<br />
«management» in relation to urban landscapes and green<br />
spaces: Toward a holistic understanding, <strong>Urban</strong> Forestry &<br />
<strong>Urban</strong> Greening 11(2), 139 - 145.<br />
Jean Claus, P.-Å. Krogstad, I. P. C. (2012), Some Measurements<br />
of Surface Drag in <strong>Urban</strong>-Type Boundary Layers at<br />
Various Wind Angles, Boundary-Layer Meteorology 145(3),<br />
407-422.<br />
Jennifer, K. V.; Jon, S. W.; Terry, J. G.; Graham, A. S.; Robert,<br />
D. B. & Natasha, A. K. (2012), Human Energy Budget<br />
Modeling in <strong>Urban</strong> Parks in Toronto and Applications to<br />
Emergency Heat Stress Preparedness, Journal of Applied<br />
Meteorology and Climatology 51(9), 1639-1653.<br />
John Kochendorfer, Tilden P. Meyers, J. F. W. J. M. M. W.<br />
H. (2012), How Well Can We Measure the Vertical Wind<br />
Speed? Implications for Fluxes of Energy and Mass,<br />
Boundary-Layer Meteorology 145, 383-398.<br />
Juraj Bartok, Andreas Bott, M. G. (2012), Fog Prediction for<br />
Road Traffic Safety in a Coastal Desert Region, Boundary-<br />
Layer Meteorology 145, 485-506.<br />
Kappes, H.; Katzschner, L. & Nowak, C. (2012), <strong>Urban</strong> summer<br />
heat load: meteorological data as a proxy for metropolitan<br />
biodiversity, Meteorologische Zeitschrift 21(5),<br />
525-528.<br />
Keeley, S. P. E.; Sutton, R. T. & Shaffrey, L. C. (2012), The<br />
ISSUE NO. 46 DECEMBER 2012 INTERNATIONAL ASSOCIATION FOR URBAN CLIMATE<br />
43<br />
impact of North Atlantic sea surface temperature errors<br />
on the simulation of North Atlantic European region climate,<br />
Quarterly Journal of the Royal Meteorological Society<br />
138(668), 1774--1783.<br />
Kilpelãinen, T.; Vihma, T.; Manninen, M.; Sjãblom, A.; Jakobson,<br />
E.; Palo, T. & Maturilli, M. (2012), Modelling the<br />
vertical structure of the atmospheric boundary layer over<br />
Arctic fjords in Svalbard, Quarterly Journal of the Royal Meteorological<br />
Society 138(668), 1867--1883.<br />
Kim, J.; Lee, J.; Kim, Y.; Lee, S.-B.; Jin, H. & Bae, G.-N. (2012),<br />
Seasonal characteristics of the gaseous and particulate<br />
PAHs at a roadside station in Seoul, Korea, Atmospheric<br />
Research 116(0), 142 - 150.<br />
Kort, E. A.; Frankenberg, C.; Miller, C. E. & Oda, T. (2012),<br />
Space-based observations of megacity carbon dioxide,<br />
Geophysical Research Letters 39(17), L17806.<br />
Kyro, R.; Heinonen, J. & Junnila, S. (2012), Housing managers<br />
key to reducing the greenhouse gas emissions of<br />
multi-family housing companies? A mixed method approach,<br />
Building and Environment 56, 203--210.<br />
Kántor, N.; Unger, J. & Agnes Gulyás (2012), Subjective estimations<br />
of thermal environment in recreational urban<br />
spaces–Part 2: international comparison, International<br />
Journal of Biometeorology 56(6), 1089-101.<br />
Lai, Y.; Li, C.; P. Lin, T. W. & Chang, C. (2012), Comparison of<br />
MODIS land surface temperature and ground-based observed<br />
air temperature in complex topography, International<br />
Journal of Remote Sensing 33(24), 7685-7702.<br />
Lan, Q.; Cui, K.; Zeng, F.; Zhu, F.; Liu, H.; Chen, H.; Ma, Y.;<br />
Wen, J.; Luan, T.; Sun, G. & Zeng, Z. (2012), Characteristics<br />
and assessment of phthalate esters in urban dusts in<br />
Guangzhou city, China, Environmental Monitoring and Assessment<br />
184(8), 4921--4929.<br />
Langmack, H.; Fraedrich, K. & Sielmann, F. (2012), Tropical<br />
cyclone track analog ensemble forecasting in the extended<br />
Australian basin: NWP combinations, Quarterly Journal<br />
of the Royal Meteorological Society 138(668), 1828--1838.<br />
Lemonsu, A.; Masson, V.; Shashua-Bar, L.; Erell, E. & Pearlmutter,<br />
D. (2012), Inclusion of vegetation in the Town<br />
Energy Balance model for modelling urban green areas,<br />
Geoscientific Model Development 5(6), 1377--1393.<br />
Li, M.; Huang, X.; Zhu, L.; Li, J.; Song, Y.; Cai, X. & Xie, S.<br />
(2012), Analysis of the transport pathways and potential<br />
sources of PM10 in Shanghai based on three methods,<br />
Science of The Total Environment 414(0), 525 - 534.<br />
Liguori, S.; Rico-Ramirez, M.; Schellart, A. & Saul, A. (2012),<br />
Using probabilistic radar rainfall nowcasts and NWP forecasts<br />
for flow prediction in urban catchments, Atmospheric<br />
Research 103(0), 80 - 95.<br />
Liu, C. & Li, X. (2012), Carbon storage and sequestration<br />
by urban forests in Shenyang, China, <strong>Urban</strong> Forestry & Ur-
Bibliography<br />
ban Greening 11(2), 121 - 128.<br />
Liu, H. Z.; Feng, J. W.; Jдrvi, L. & Vesala, T. (2012), Four-year<br />
(2006-2009) eddy covariance measurements of CO2 flux<br />
over an urban area in Beijing, Atmospheric Chemistry and<br />
Physics 12(17), 7881--7892.<br />
Loridan, T. & C, S. B. G. (2012), Characterization of Energy<br />
Flux Partitioning in <strong>Urban</strong> Environments: Links with Surface<br />
Seasonal Properties, Journal of Applied Meteorology<br />
and Climatology 51(2), 219-241.<br />
Lunde, K. B. & Resh, V. H. (2012), Development and validation<br />
of a macroinvertebrate index of biotic integrity<br />
(IBI) for assessing urban impacts to Northern California<br />
freshwater wetlands, Environmental Monitoring and Assessment<br />
184(6), 3653--3674.<br />
Lv, Z.-q.; Dai, F.-q. & Sun, C. (2012), Evaluation of urban<br />
sprawl and urban landscape pattern in a rapidly developing<br />
region, Environmental Monitoring and Assessment<br />
184(10), 6437--6448.<br />
Lyamani, H.; Fernández-Gálvez, J.; Pérez-Ramírez, D.; Valenzuel,<br />
A.; Antón, M.; Alados, I.; Titos, G.; Olmo, F. & Alados-Arboledas,<br />
L. (2012), Aerosol properties over two urban<br />
sites in South Spain during an extended stagnation<br />
episode in winter season, Atmospheric Environment 62,<br />
424-432.<br />
Ma, W.; Yang, C.; Tan, J.; Song, W.; Chen, B. & Kan, H. (2012),<br />
Modifiers of the temperature-mortality association in<br />
Shanghai, China, International Journal of Biometeorology<br />
56(1), 205-7.<br />
Martin, S. L.; Cakmak, S.; Hebbern, C. A.; Avramescu, M.-l. &<br />
Tremblay, N. (2012), <strong>Climate</strong> change and future temperature-related<br />
mortality in 15 Canadian cities, International<br />
Journal of Biometeorology 56(4), 605-19.<br />
Mcgregor, G. R. (2012), Special issue: Universal Thermal<br />
Comfort Index (UTCI), International Journal of Biometeorology<br />
56(3), 419-419.<br />
McLain, R.; Poe, M.; Hurley, P. T.; Lecompte-Mastenbrook,<br />
J. & Emery, M. R. (2012), Producing edible landscapes in<br />
Seattles urban forest, <strong>Urban</strong> Forestry & <strong>Urban</strong> Greening<br />
11(2), 187 - 194.<br />
Melvin, T.; Staniforth, A. & Thuburn, J. (2012), Dispersion<br />
analysis of the spectral element method, Quarterly Journal<br />
of the Royal Meteorological Society 138(668), 1934--<br />
1947.<br />
Migliavacca, D. M.; Teixeira, E. C.; Gervasoni, F.;<br />
Conceição, R. V. & Rodriguez, M. T. R. (2012), Metallic<br />
elements and isotope of Pb in wet precipitation in urban<br />
area, South America, Atmospheric Research 107(0), 106 -<br />
114.<br />
Miron, I. J.; Montero, J. C.; Criado-Alvarez, J.; Linares, C. &<br />
Díaz, J. (2012), Intense cold and mortality in Castile-La<br />
Mancha (Spain): study of mortality trigger thresholds<br />
ISSUE NO. 46 DECEMBER 2012 INTERNATIONAL ASSOCIATION FOR URBAN CLIMATE<br />
44<br />
from 1975 to 2003, International Journal of Biometeorology<br />
56(1), 145-52.<br />
Mirzaei, P. A.; Haghighat, F.; Nakhaie, A. A.; Yagouti, A.;<br />
Giguere, M.; Keusseyan, R. & Coman, A. (2012), Indoor<br />
thermal condition in urban heat Island - Development of<br />
a predictive tool, Building and Environment 57, 7--17.<br />
Mitchell, D. M.; Charlton-Perez, A. J.; Gray, L. J.; Akiyoshi,<br />
H.; Butchart, N.; Hardiman, S. C.; Morgenstern, O.; Nakamura,<br />
T.; Rozanov, E.; Shibata, K.; Smale, D. & Yamashita,<br />
Y. (2012), The nature of Arctic polar vortices in chemistry–climate<br />
models, Quarterly Journal of the Royal Meteorological<br />
Society 138(668), 1681-1691.<br />
Mittermaier, M. (2012), A critical assessment of surface<br />
cloud observations and their use for verifying cloud forecasts,<br />
Quarterly Journal of the Royal Meteorological Society<br />
138(668), 1794--1807.<br />
de Moraes Dias, V. R.; Sanches, L.; de Carvalho Alves, M.<br />
& de Souza Nogueira, J. (2012), Spatio-temporal variability<br />
of anions in wet precipitation of Cuiabá, Brazil, Atmospheric<br />
Research 107(0), 9 - 19.<br />
Murillo, J. H.; Ramos, A. C.; Ángeles García, F.; Jiménez, S.<br />
B.; Cárdenas, B. & Mizohata, A. (2012), Chemical composition<br />
of PM2.5 particles in Salamanca, Guanajuato Mexico:<br />
Source apportionment with receptor models, Atmospheric<br />
Research 107(0), 31 - 41.<br />
Muthulingam, U. & Thangavel, S. (2012), Density, diversity<br />
and richness of woody plants in urban green spaces: A<br />
case study in Chennai metropolitan city, <strong>Urban</strong> Forestry &<br />
<strong>Urban</strong> Greening 11(4), 450 - 459.<br />
Novikov, I.; Kalter-leibovici, O.; Chetrit, A.; Stav, N. & Epstein,<br />
Y. (2012), Weather conditions and visits to the medical<br />
wing of emergency rooms in a metropolitan area<br />
during the warm season in Israel: a predictive model, International<br />
Journal of Biometeorology 56(1), 121-7.<br />
Nowak, D. J. (2012), Contrasting natural regeneration and<br />
tree planting in fourteen North American cities, <strong>Urban</strong><br />
Forestry & <strong>Urban</strong> Greening 11(4), 374 - 382.<br />
Nuterman, R.; Starchenko, A. & Baklanov, A. (2011), Numerical<br />
model of urban aerodynamics and pollution dispersion,<br />
Int. J. of Environment and Pollution 44(1/2/3/4).<br />
Oikonomou, E.; Davies, M.; Mavrogianni, A.; Biddulph, P.;<br />
Wilkinson, P. & Kolokotroni, M. (2012), Modelling the relative<br />
importance of the urban heat island and the thermal<br />
quality of dwellings for overheating in London, Building<br />
and Environment 57, 223--238.<br />
Olaru, E.-A.; Offer, Z. Y.; Ruta, F. & Udrea, I. (2012), Chemical<br />
and micromorphological properties of TSP and PM10 particles:<br />
case study in Bucharest urban area, Environmental<br />
Monitoring and Assessment 184(8), 4737--4745.<br />
Omrani, H.; Drobinski, P. & Dubos, T. (2012), Spectral nudging<br />
in regional climate modelling: how strongly should
Bibliography<br />
we nudge?, Quarterly Journal of the Royal Meteorological<br />
Society 138(668), 1808--1813.<br />
Ostro, B.; Barrera-Gómez, J.; Ballester, J.; Basagaña, X. &<br />
Sunyer, J. (2012), The impact of future summer temperature<br />
on public health in Barcelona and Catalonia, Spain,<br />
International Journal of Biometeorology 56(6), 1135-44.<br />
Pandolfi, M.; Amato, F.; Reche, C.; Alastuey, A.; Otjes, R. P.;<br />
Blom, M. J. & Querol, X. (2012), Summer ammonia measurements<br />
in a densely populated Mediterranean city, Atmospheric<br />
Chemistry and Physics 12(16), 7557--7575.<br />
Park, S.-B.; Baik, J.-J.; Raasch, S. & Marcus, O. L. (2012), A<br />
Large-Eddy Simulation Study of Thermal Effects on Turbulent<br />
Flow and Dispersion in and above a Street Canyon,<br />
Journal of Applied Meteorology and Climatology 51(5),<br />
829-841.<br />
Perrone, M.; Larsen, B.; Ferrero, L.; Sangiorgi, G.; Gennaro,<br />
G. D.; Udisti, R.; Zangrando, R.; Gambaro, A. & Bolzacchini,<br />
E. (2012), Sources of high PM2.5 concentrations in Milan,<br />
Northern Italy: Molecular marker data and CMB modelling,<br />
Science of The Total Environment 414(0), 343 - 355.<br />
Peschardt, K. K.; Schipperijn, J. & Stigsdotter, U. K. (2012),<br />
Use of Small Public <strong>Urban</strong> Green Spaces (SPUGS), <strong>Urban</strong><br />
Forestry & <strong>Urban</strong> Greening 11(3), 235 - 244.<br />
Pius, A.; Jerome, C. & Sharma, N. (2012), Evaluation of<br />
groundwater quality in and around Peenya industrial area<br />
of Bangalore, South India using GIS techniques, Environmental<br />
Monitoring and Assessment 184(7), 4067--4077.<br />
Pun, C. S. J. & So, C. W. (2012), Night-sky brightness monitoring<br />
in Hong Kong A city-wide light pollution assessment,<br />
Environmental Monitoring and Assessment 184(4),<br />
2537--2557.<br />
Quang, T. N.; He, C.; Morawska, L.; Knibbs, L. D. & Falk, M.<br />
(2012), Vertical particle concentration profiles around urban<br />
office buildings, Atmospheric Chemistry and Physics<br />
12(11), 5017--5030.<br />
Reynolds, D. W.; Clark, D. A.; Wilson W. & Cook, L. (2012),<br />
Forecast-Based Decision Support for San Francisco International<br />
Airport: A NextGen Prototype System That Improves<br />
Operations during Summer Stratus Season, Bulletin<br />
of the American Meteorological Society 93, 1503-1518.<br />
Richard D. Crago, Winnie Okello, M. F. J. (2012), Equations<br />
for the Drag Force and Aerodynamic Roughness Length<br />
of <strong>Urban</strong> Areas with Random Building Heights, Boundary-<br />
Layer Meteorology 145, 423-437.<br />
Richnau, G.; Wistrom, B.; Nielsen, A. B. & Lof, M. (2012),<br />
Creation of multi-layered canopy structures in young<br />
oak-dominated urban woodlands - The ‘ecological approach’<br />
revisited, <strong>Urban</strong> Forestry & <strong>Urban</strong> Greening 11(2),<br />
147 - 158.<br />
Ringuet, J.; Leoz-Garziandia, E.; Budzinski, H.; Villenave,<br />
E. & Albinet, A. (2012), Particle size distribution of nitrat-<br />
ISSUE NO. 46 DECEMBER 2012 INTERNATIONAL ASSOCIATION FOR URBAN CLIMATE<br />
45<br />
ed and oxygenated polycyclic aromatic hydrocarbons<br />
(NPAHs and OPAHs) on traffic and suburban sites of a European<br />
megacity: Paris (France), Atmospheric Chemistry<br />
and Physics 12(18), 8877--8887.<br />
Rodriguez, L. M.; Bieringer, P. E. & Warner, T. (2013), <strong>Urban</strong><br />
transport and dispersion model sensitivity to wind direction<br />
uncertainty and source location, Atmospheric Environment<br />
64(0), 25--39.<br />
Roy, S.; Byrne, J. & Pickering, C. (2012), A systematic quantitative<br />
review of urban tree benefits, costs, and assessment<br />
methods across cities in different climatic zones,<br />
<strong>Urban</strong> Forestry & <strong>Urban</strong> Greening 11(4), 351 - 363.<br />
Ryu, Y.-H. & Baik, J.-J. (2012), Quantitative Analysis of Factors<br />
Contributing to <strong>Urban</strong> Heat Island Intensity, Journal<br />
of Applied Meteorology and Climatology 51(5), 842-854.<br />
Saarikoski, S.; Carbone, S.; Decesari, S.; Giulianelli, L.; Angelini,<br />
F.; Canagaratna, M.; Ng, N. L.; Trimborn, A.; Facchini,<br />
M. C.; Fuzzi, S.; Hillamo, R. & Worsnop, D. (2012), Chemical<br />
characterization of springtime submicrometer aerosol in<br />
Po Valley, Italy, Atmospheric Chemistry and Physics 12(18),<br />
8401--8421.<br />
Sabatino, S. D.; Buccolieri, R.; Olesen, H. R.; Ketzel, M.;<br />
Berkowicz, R.; Franke, J.; Schatzmann, M.; Schlunzen, K. H.;<br />
Leitl, B.; Britter, R.; Borrego, C.; Costa, A. M.; Castelli, S. T.;<br />
Reisin, T. G.; Hellsten, A.; Saloranta, J.; Moussiopoulos, N.;<br />
Barmpas, F.; Brzozowski, K.; Goricsan, I.; Balczo, M.; Bartzi,<br />
J. G.; Efthimiou, G.; Santiago, J. L.; Martilli, A.; Piringer, M.;<br />
Baumann-Stanzer, K.; Hirtl, M.; Baklanov, A. A.; Nuterman,<br />
R. B. & Starchenko, A. V. (2011), COST 732 in practice: the<br />
MUST model evaluation exercise, Int. J. of Environment<br />
and Pollution 44(1/2/3/4), 403 - 418.<br />
Sachiho, A. A.; Kimura, F.; Kusaka, H.; Inoue, T. & Ueda,<br />
H. (2012), Comparison of the Impact of Global <strong>Climate</strong><br />
Changes and <strong>Urban</strong>ization on Summertime Future <strong>Climate</strong><br />
in the Tokyo Metropolitan Area, Journal of Applied<br />
Meteorology and Climatology 51(8), 1441-1454.<br />
Salcedo, D.; Castro, T.; Ruiz-Suárez, L.; Garciã-Reynoso, A.;<br />
Torres-Jardãn, R.; Torres-Jaramillo, A.; Mar-Morales, B.; Salcido,<br />
A.; Celada, A.; Carreón-Sierra, S.; Martãnez, A.; Fentanes-Arriaga,<br />
O.; Deustã, E.; Ramos-Villegas, R.; Retama-<br />
Hernãndez, A.; Saavedra, M. & Suárez-Lastra, M. (2012),<br />
Study of the regional air quality south of Mexico City (Morelos<br />
state), Science of The Total Environment 414(0), 417<br />
- 432.<br />
Salmond, J. A.; Roth, M.; Oke, T. R.; Christen, A. & Voogt,<br />
J. A. (2012), Can Surface-Cover Tiles Be Summed to Give<br />
Neighborhood Fluxes in Cities?, Journal of Applied Meteorology<br />
and Climatology 51(1), 133-149.<br />
Saloranta, J. & Hellsten, A. (2011), Evaluation of a general<br />
CFD-solver for a micro-scale urban flow, Int. J. of Environment<br />
and Pollution 44(1/2/3/4), 368 - 375.
Bibliography<br />
Santiago-Melãndez, S.; Gonzãlez, S. & Goenaga, R. (2012),<br />
Evaluation of an agricultural experiment station as a case<br />
study site for the establishment of a multi-use urban forest,<br />
<strong>Urban</strong> Forestry & <strong>Urban</strong> Greening 11(4), 406 - 416.<br />
Satsangi, A.; Pachauri, T.; Singla, V.; Lakhani, A. & Kumari,<br />
K. M. (2012), Organic and elemental carbon aerosols at a<br />
suburban site, Atmospheric Research 113(0), 13 - 21.<br />
Satyanarayana Mohan, T. & Narayana Rao, T. (2012), Variability<br />
of the thermal structure of the atmosphere during<br />
wet and dry spells over southeast India, Quarterly Journal<br />
of the Royal Meteorological Society 138(668), 1839--1851.<br />
Schnell, I.; Potchter, O.; Yaakov, Y.; Epstein, Y.; Brener, S. &<br />
Hermesh, H. (2012), <strong>Urban</strong> daily life routines and human<br />
exposure to environmental discomfort, Environmental<br />
Monitoring and Assessment 184(7), 4575--4590.<br />
Sebastian Schubert, Susanne Grossman-Clarke, A. M.<br />
(2012), A Double-Canyon Radiation Scheme for Multi-<br />
Layer <strong>Urban</strong> Canopy Models, Boundary-Layer Meteorology<br />
145, 439-468.<br />
Shahidan, M. F.; Jones, P. J.; Gwilliam, J. & Salleh, E. (2012),<br />
An evaluation of outdoor and building environment cooling<br />
achieved through combination modification of trees<br />
with ground materials, Building and Environment 58, 245-<br />
-257.<br />
Shalaby, A. A.; Wahab, M. A.; Anyah, R. & Yousef, A. (2012),<br />
Non-hydrostatic hybrid-coordinate modelling: Simulation<br />
of extreme weather event on 20-22 April 2005 in<br />
Cairo, Egypt, Atmospheric Research 108(0), 74 - 85.<br />
Sham, J. F. C.; Lo, T. Y. & Memon, S. A. (2012), Verification<br />
and application of continuous surface temperature monitoring<br />
technique for investigation of nocturnal sensible<br />
heat release characteristics by building fabrics, Energy<br />
and Buildings 53, 108--116.<br />
Shan, X.-Z. (2012), Attitude and willingness toward participation<br />
in decision-making of urban green spaces in<br />
China, <strong>Urban</strong> Forestry & <strong>Urban</strong> Greening 11(2), 211 - 217.<br />
Sharan, M.; Issartel, J.-P. & Singh, S. K. (2012), A pointsource<br />
reconstruction from concentration measurements<br />
in low-wind stable conditions, Quarterly Journal of the<br />
Royal Meteorological Society 138(668), 1884--1894.<br />
Shashua-Bar, L.; Tsiros, I. X. & Hoffman, M. (2012), Passive<br />
cooling design options to ameliorate thermal comfort in<br />
urban streets of a Mediterranean climate (Athens) under<br />
hot summer conditions, Building and Environment 57,<br />
110--119.<br />
Sievers, U., F. B. (2012), A practical approach to compute<br />
short-wave irradiance interacting with subgrid-scale<br />
buildings, Meteorologische Zeitschrift 21(4), 349-364.<br />
Simon, E.; Puky, M.; Braun, M. & Tothmeresz, B. (2012), Assessment<br />
of the effects of urbanization on trace elements<br />
of toe bones, Environmental Monitoring and Assessment<br />
184(9), 5749--5754.<br />
Slini, T.; Walker, S. E. & Moussiopoulos, N. (2011), Data assimilation<br />
within the Air4EU project: the Athens case, Int.<br />
J. of Environment and Pollution 44(1/2/3/4), 298 - 306.<br />
Smith, R. K. & Montgomery, M. T. (2012), Observations of<br />
the convective environment in developing and non-developing<br />
tropical disturbances, Quarterly Journal of the<br />
Royal Meteorological Society 138(668), 1721--1739.<br />
Song, P.; Geng, F.-H.; Sang, X.-F.; Chan, C.-Y.; Chan, L.-Y. &<br />
Yu, Q. (2012), Characteristics and sources of non-methane<br />
hydrocarbons and halocarbons in wintertime urban atmosphere<br />
of Shanghai, China, Environmental Monitoring<br />
and Assessment 184(10), 5957--5970.<br />
Song, T. & Wang, Y. (2012), Carbon dioxide fluxes from an<br />
urban area in Beijing, Atmospheric Research 106(0), 139 -<br />
149.<br />
Speak, A.; Rothwell, J.; Lindley, S. & Smith, C. (2012), <strong>Urban</strong><br />
particulate pollution reduction by four species of green<br />
roof vegetation in a UK city, Atmospheric Environment 61,<br />
283-293.<br />
Speak, A.F., R. J. L. S. S. C. (2012), <strong>Urban</strong> particulate pollution<br />
reduction by four species of green roof vegetation in<br />
a UK city, Atmospheric Environment 61, 283-293.<br />
Stolle, J.; Lovejoy, S. & Schertzer, D. (2012), The temporal<br />
cascade structure of reanalyses and global circulation<br />
models, Quarterly Journal of the Royal Meteorological Society<br />
138(668), 1895--1913.<br />
Struzewska, J. & Kaminski, J. W. (2012), Impact of urban<br />
parameterization on high resolution air quality forecast<br />
with the GEM-AQ model, Atmospheric Chemistry and Physics<br />
12(21), 10387--10404.<br />
Suthawaree, J.; Tajima, Y.; Khunchornyakong, A.; Kato, S.;<br />
Sharp, A. & Kajii, Y. (2012), Identification of volatile organic<br />
compounds in suburban Bangkok, Thailand and their<br />
potential for ozone formation, Atmospheric Research 104-<br />
105(0), 245 - 254.<br />
Takenobu Michioka, A. S. (2012), Effect of Incoming Turbulent<br />
Structure on Pollutant Removal from Two-Dimensional<br />
Street Canyon, Boundary-Layer Meteorology 145,<br />
469-484.<br />
Termonia, P.; Smet, G. & Van den Bergh, J. (2012), On the<br />
role of tuning in parametrizations of unresolved diffusive<br />
processes in atmospheric models, Quarterly Journal of the<br />
Royal Meteorological Society 138(668), 1923--1933.<br />
Tian, Y. & Jim, C. (2012), Development potential of sky gardens<br />
in the compact city of Hong Kong, <strong>Urban</strong> Forestry &<br />
<strong>Urban</strong> Greening 11(3), 223 - 233.<br />
Ugolini, F.; Bussotti, F.; Lanini, G.; Raschi, A.; Tani, C. &<br />
Tognetti, R. (2012), Leaf gas exchanges and photosystem<br />
efficiency of the holm oak in urban green areas of Flor-<br />
ISSUE NO. 46 DECEMBER 2012 INTERNATIONAL ASSOCIATION FOR URBAN CLIMATE<br />
4
Bibliography<br />
ence, Italy, <strong>Urban</strong> Forestry & <strong>Urban</strong> Greening 11(3), 313 -<br />
319.<br />
Ullah, H.; Khan, I. & Ullah, I. (2012), Impact of sewage contaminated<br />
water on soil, vegetables, and underground<br />
water of peri-urban Peshawar, Pakistan, Environmental<br />
Monitoring and Assessment 184(10), 6411--6421.<br />
<strong>Urban</strong>, J. T.; Warner, S.; Platt, N. & Heagy, J. F. (2011), Assessment<br />
of HPAC urban modelling capabilities using<br />
data from the Joint <strong>Urban</strong> 2003 field experiment, Int. J. of<br />
Environment and Pollution 44,(1/2/3/4), 24-31.<br />
Vanos, J. K.; Warland, J. S.; Gillespie, T. J. & Kenny, N. A.<br />
(2012), Improved predictive ability of climate-humanbehaviour<br />
interactions with modifications to the COMFA<br />
outdoor energy budget model, International Journal of<br />
Biometeorology 56(6), 1065-74.<br />
Vetra-Carvalho, S.; Dixon, M.; Migliorini, S.; Nichols, N. K. &<br />
Ballard, S. P. (2012), Breakdown of hydrostatic balance at<br />
convective scales in the forecast errors in the Met Office<br />
Unified Model, Quarterly Journal of the Royal Meteorological<br />
Society 138(668), 1709--1720.<br />
Wang, F.; Kummerow, C.; Geer, A. J.; Bauer, P. & Elsaesser,<br />
G. (2012), Comparing rain retrievals from GPROF with EC-<br />
MWF 1D-Var products, Quarterly Journal of the Royal Meteorological<br />
Society 138(668), 1852--1866.<br />
Wang, H.; Zhang, R.; Liu, M. & Bi, J. (2012), The carbon emissions<br />
of Chinese cities, Atmospheric Chemistry and Physics<br />
12(14), 6197--6206.<br />
Wang, L.; Kodera, K. & Chen, W. (2012), Observed triggering<br />
of tropical convection by a cold surge: implications<br />
for MJO initiation, Quarterly Journal of the Royal Meteorological<br />
Society 138(668), 1740--1750.<br />
Wang, M.; Markert, B.; Chen, W.; Peng, C. & Ouyang, Z.<br />
(2012), Identification of heavy metal pollutants using<br />
multivariate analysis and effects of land uses on their accumulation<br />
in urban soils in Beijing, China, Environmental<br />
Monitoring and Assessment 184(10), 5889--5897.<br />
Wang, Y.; Konopka, P.; Liu, Y.; Chen, H.; Müller, R.; Plцger, F.;<br />
Riese, M.; Cai, Z. & Lü, D. (2012), Tropospheric ozone trend<br />
over Beijing from 2002-2010: ozonesonde measurements<br />
and modeling analysis, Atmospheric Chemistry and Physics<br />
12(18), 8389--8399.<br />
Wegner, T.; Hussein, T.; Hämeri, K.; Vesala, T.; Kulmala, M. &<br />
Weber, S. (2012), Properties of aerosol signature size distributions<br />
in the urban environment as derived by cluster<br />
analysis, Atmospheric Environment 61, 350-360.<br />
Weltecke, K. & Gaertig, T. (2012), Influence of soil aeration<br />
on rooting and growth of the Beuys-trees in Kassel, Germany,<br />
<strong>Urban</strong> Forestry & <strong>Urban</strong> Greening 11(3), 329 - 338.<br />
Willems, P.; Arnbjerg-Nielsen, K.; Olsson, J. & Nguyen, V.<br />
(2012), <strong>Climate</strong> change impact assessment on urban rainfall<br />
extremes and urban drainage: Methods and short-<br />
comings, Atmospheric Research 103(0), 106 - 118.<br />
ISSUE NO. 46 DECEMBER 2012 INTERNATIONAL ASSOCIATION FOR URBAN CLIMATE<br />
47<br />
Willems, P.; Molnar, P.; Einfalt, T.; Arnbjerg-Nielsen, K.;<br />
Onof, C.; Nguyen, V.-T.-V. & Burlando, P. (2012), Rainfall in<br />
the urban context: Forecasting, risk and climate change,<br />
Atmospheric Research 103(0), 1 - 3.<br />
William, B. G.; Woo, J.; Ho, S.; Emily, Y. Y. C. & P, H. C. (2012),<br />
Weather, season, and daily stroke admissions in Hong<br />
Kong, International Journal of Biometeorology 56(5), 865-<br />
72.<br />
Williams, S.; Nitschke, M.; Sullivan, T.; Tucker, G. R.; Weinstein,<br />
P.; Pisaniello, D. L.; Parton, K. A. & Bi, P. (2012), Heat<br />
and health in Adelaide, South Australia: Assessment of<br />
heat thresholds and temperature relationships, Science of<br />
The Total Environment 414(0), 126 - 133.<br />
Wolters, D. & Brandsma, T. (2012), Estimating the <strong>Urban</strong><br />
Heat Island in Residential Areas in the Netherlands Using<br />
Observations by Weather Amateurs, Journal of Applied<br />
Meteorology and Climatology 51(4), 711-721.<br />
Wouters, H., Koen De Ridder, N. P. M. v. L. (2012), Comprehensive<br />
Parametrization of Surface-Layer Transfer Coefficients<br />
for Use in Atmospheric Numerical Models, Boundary-Layer<br />
Meteorology 145, 539-550.<br />
Wu, Q.; Han, G.; Tao, F. & Tang, Y. (2012), Chemical composition<br />
of rainwater in a karstic agricultural area, Southwest<br />
China: The impact of urbanization, Atmospheric Research<br />
111(0), 71 - 78.<br />
Wu, W.; Zhang, G. & Kai, P. (2012), Ammonia and methane<br />
emissions from two naturally ventilated dairy cattle<br />
buildings and the influence of climatic factors on ammonia<br />
emissions, Atmospheric Environment 61, 232-243.<br />
Xu, J.; Tao, J.; Zhang, R.; Cheng, T.; Leng, C.; Chen, J.; Huang,<br />
G.; Li, X. & Zhu, Z. (2012), Measurements of surface aerosol<br />
optical properties in winter of Shanghai, Atmospheric Research<br />
109-110(0), 25 - 35.<br />
Xu, K.; Kong, C.; Li, J. & Zhang, L. (2012), GEO-Environmental<br />
Suitability Evaluation of Land for <strong>Urban</strong> Construction<br />
Based on A Back-Propagation Neural Network and GIS: A<br />
Case Study of Hangzhou, Physical Geography 33(5), 457--<br />
472.<br />
Xu, L.; Chen, X.; Chen, J.; Zhang, F.; He, C.; Zhao, J. & Yin, L.<br />
(2012), Seasonal variations and chemical compositions of<br />
PM2.5 aerosol in the urban area of Fuzhou, China, Atmospheric<br />
Research 104-105(0), 264 - 272.<br />
Xu, Z.; Tang, Y. & Ji, J. (2012), Chemical and strontium isotope<br />
characterization of rainwater in Beijing during the<br />
2008 Olympic year, Atmospheric Research 107(0), 115 -<br />
125.<br />
Yaghoobian, N. & Kleissl, J. (2012), Effect of Reflective Pavements<br />
on Building Energy Use, <strong>Urban</strong> <strong>Climate</strong> 2, 25-42.
Conferences 4<br />
Yang, F.; Tan, J.; Shi, Z. B.; Cai, Y.; He, K.; Ma, Y.; Duan, F.;<br />
Okuda, T.; Tanaka, S. & Chen, G. (2012), Five-year record<br />
of atmospheric precipitation chemistry in urban Beijing,<br />
China, Atmospheric Chemistry and Physics 12(4), 2025--<br />
2035.<br />
Yang, J. (2012), <strong>Urban</strong> Forestry in Challenging Environments,<br />
<strong>Urban</strong> Forestry & <strong>Urban</strong> Greening 11(2), 103 - 104.<br />
Yang, J.; Zhou, J.; Ke, Y. & Xiao, J. (2012), Assessing the<br />
structure and stability of street trees in Lhasa, China, <strong>Urban</strong><br />
Forestry & <strong>Urban</strong> Greening 11(4), 432 - 438.<br />
Yang, L.; Xia, X. & Hu, L. (2012), Distribution and Health<br />
Risk Assessment of HCHs in <strong>Urban</strong> Soils of Beijing, China,<br />
Environmental Monitoring and Assessment 184(4), 2377-<br />
-2387.<br />
Yaremchuk, M. & Sentchev, A. (2012), Multi-scale correlation<br />
functions associated with polynomials of the diffusion<br />
operator, Quarterly Journal of the Royal Meteorological<br />
Society 138(668), 1948--1953.<br />
Yin, J.; Zheng, Y.; Wu, R.; Tan, J.; Ye, D. & Wang, W. (2012), An<br />
analysis of influential factors on outdoor thermal comfort<br />
in summer, International Journal of Biometeorology 56(5),<br />
941-8.<br />
Yu, Y. C. & Foy, B. D. (2012), Seasonal Variations of the <strong>Urban</strong><br />
Heat Island at the Surface and the Near-Surface and<br />
Reductions due to <strong>Urban</strong> Vegetation in Mexico City, Journal<br />
of Applied Meteorology and Climatology 51(5), 855-<br />
868.<br />
Zalakeviciute, R.; Alexander, M. L.; Allwine, E.; Jimenez, J.<br />
L.; Jobson, B. T.; Molina, L. T.; Nemitz, E.; Pressley, S.; Van-<br />
Reken, T. M.; Ulbrich, I. M.; Velasco, E. & Lamb, B. K. (2012),<br />
Chemically-resolved aerosol eddy covariance flux measurements<br />
in urban Mexico City during MILAGRO 2006,<br />
Atmospheric Chemistry and Physics 12(16), 7809--7823.<br />
Zaveri, R. A.; Shaw, W. J.; Cziczo, D. J.; Schmid, B.; Ferrare, R.<br />
A.; Alexander, M. L.; Alexandrov, M.; Alvarez, R. J.; Arnott,<br />
W. P.; Atkinson, D. B.; Baidar, S.; Banta, R. M.; Barnard, J. C.;<br />
Beranek, J.; Berg, L. K.; Brechtel, F.; Brewer, W. A.; Cahill, J.<br />
Upcoming Conferences...<br />
INTERNATIONAL CONFERENCE ON URBAN CLI-<br />
MATE AND HISTORY OF METEOROLOGY<br />
Florence, Italy • February 25-26, 2013<br />
http://web.fi.ibimet.cnr.it/urbanclimate<br />
2013 AAG ANNUAL MEETING: SPECIAL SESSION<br />
ON URBAN WEATHER AND CLIMATES<br />
Los Angeles, CA • April 9-13, 2013<br />
http://www.aag.org/annualmeeting<br />
F.; Cairns, B.; Cappa, C. D.; Chand, D.; China, S.; Comstock, J.<br />
M.; Dubey, M. K.; Easter, R. C.; Erickson, M. H.; Fast, J. D.; Floerchinger,<br />
C.; Flowers, B. A.; Fortner, E.; Gaffney, J. S.; Gilles,<br />
M. K.; Gorkowski, K.; Gustafson, W. I.; Gyawali, M.; Hair, J.;<br />
Hardesty, R. M.; Harworth, J. W.; Herndon, S.; Hiranuma, N.;<br />
Hostetler, C.; Hubbe, J. M.; Jayne, J. T.; Jeong, H.; Jobson,<br />
B. T.; Kassianov, E. I.; Kleinman, L. I.; Kluzek, C.; Knighton,<br />
B.; Kolesar, K. R.; Kuang, C.; Kubatova, A.; Langford, A. O.;<br />
Laskin, A.; Laulainen, N.; Marchbanks, R. D.; Mazzoleni, C.;<br />
Mei, F.; Moffet, R. C.; Nelson, D.; Obland, M. D.; Oetjen, H.;<br />
Onasch, T. B.; Ortega, I.; Ottaviani, M.; Pekour, M.; Prather,<br />
K. A.; Radney, J. G.; Rogers, R. R.; Sandberg, S. P.; Sedlacek,<br />
A.; Senff, C. J.; Senum, G.; Setyan, A.; Shilling, J. E.; Shrivastava,<br />
M.; Song, C.; Springston, S. R.; Subramanian, R.; Suski,<br />
K.; Tomlinson, J.; Volkamer, R.; Wallace, H. W.; Wang, J.;<br />
Weickmann, A. M.; Worsnop, D. R.; Yu, X. .. Y.; Zelenyuk, A.<br />
& Zhang, Q. (2012), Overview of the 2010 Carbonaceous<br />
Aerosols and Radiative Effects Study (CARES), Atmospheric<br />
Chemistry and Physics 12(16), 7647--7687.<br />
Zhan, W.; Chen, Y.; Voogt, J.; Zhou, J.; Wang, J.; Liu, W. &<br />
Ma, W. (2012), Interpolating diurnal surface temperatures<br />
of an urban facet using sporadic thermal observations,<br />
Building and Environment 57, 239--252.<br />
Zhang, F.; Xu, L.; Chen, J.; Yu, Y.; Niu, Z. & Yin, L. (2012), Chemical<br />
compositions and extinction coefficients of PM2.5 in<br />
peri-urban of Xiamen, China, during June 2009–May<br />
2010, Atmospheric Research 106(0), 150 - 158.<br />
Zhang, X.; He, S. Z.; Chen, Z. M.; Zhao, Y. & Hua, W. (2012),<br />
Methyl hydroperoxide in urban, suburban and rural atmosphere:<br />
ambient concentration, budget, and contribution<br />
to the atmospheric oxidizing capacity, Atmospheric<br />
Chemistry and Physics 12(19), 8951--8962.<br />
Zhang, X. Y.; Wang, Y. Q.; Niu, T.; Zhang, X. C.; Gong, S. L.;<br />
Zhang, Y. M. & Sun, J. Y. (2012), Atmospheric aerosol compositions<br />
in China: spatial/temporal variability, chemical<br />
signature, regional haze distribution and comparisons<br />
with global aerosols, Atmospheric Chemistry and Physics<br />
12(2), 779--799.<br />
HARMONISATION WITHIN ATMOSPHERIC DISPER-<br />
SION MODELLING FOR REGULATORY PURPOSES<br />
Madrid, Spain • May 6-9, 2013<br />
http://www.harmo.org/harmo15<br />
6TH INTERNATIONAL CONFERENCE ON FOG, FOG<br />
COLLECTION AND DEW<br />
Yokohama, Japan • May 19-24, 2013<br />
http://www.fogconference.org/<br />
ISSUE NO. 46 DECEMBER 2012 INTERNATIONAL ASSOCIATION FOR URBAN CLIMATE
IAUC Board<br />
Luke Howard Award Nominations<br />
I am pleased to announce the call for nominations to<br />
the ‘Luke Howard Award for Outstanding Contributions to<br />
the Field of <strong>Urban</strong> Climatology.’ The Luke Howard Award<br />
may be given annually to an individual who has made outstanding<br />
contributions to the field of urban climatology in<br />
a combination of research, teaching, and/or service to the<br />
international community of urban climatologists.<br />
IAUC members are requested to nominate suitable candidates<br />
for the Luke Howard Award. The person making<br />
the nomination will act as the coordinator to put together<br />
a nomination package (including a CV of the nominee<br />
and three letters of recommendation). Self nominations<br />
are not permitted and current Awards Committee members<br />
cannot be evaluated. Complete nomination packets<br />
(single electronic submission) are to be submitted to the<br />
Awards Committee Chair. Dr Jason Ching (jasonching@embarqmail.com)<br />
or (jksching@gmail.com) is the Chair of the<br />
Awards Committee.<br />
Luke Howard Award Nomination Process<br />
1. Nomination materials should be collected by a nomination<br />
coordinator (i.e. the first person to notify the Chair<br />
of the IAUC Awards Committee that a particular person will<br />
be nominated);<br />
2. Self nominations are NOT permitted.<br />
3. The coordinator should collect the following documentation:<br />
a) a five page candidate CV<br />
b) three letters of recommendation from IAUC members<br />
from at least two different countries which are two pages in<br />
length.<br />
4. Complete packages should reach the Chair by the announced<br />
deadline. Please advise the Chair of the committee<br />
early in the nomination process of the candidate you<br />
have selected to avoid duplication of effort.<br />
Please note that nominations which were not successful<br />
may be reconsidered in subsequent years at the discretion<br />
of the committee. The IAUC Awards committee will recommend<br />
the name of a recipient for consideration and approval<br />
by the IAUC Board.<br />
Previous winners include:<br />
2010 John Arnfield, The Ohio State University, USA<br />
2009 Sue Grimmond, King’s College, UK<br />
2008 Bob Bornstein, San José State University, USA<br />
2007 Masatoshi Yoshino, University of Tsukuba, Japan<br />
2006 Arieh Bitan, Tel Aviv University, Israel<br />
2005 Ernesto Jauregui, UNAM, Mexico<br />
2004 Tim Oke, UBC, Canada<br />
Nominations should reach the Chair of the Awards Committee<br />
(Dr Jason Ching, email above) before 15 February<br />
2013.<br />
Thank you,<br />
Rohinton Emmanuel<br />
Secretary, IAUC<br />
Presentation of 2007<br />
Board Members & Terms<br />
Luke Howard Award<br />
Jennifer • Tim Oke Salmond, (University IAUC Secretary of British Columbia, Canada): President,<br />
2000-2003; Past President, 2003-2006; Emeritus<br />
President 2007-2009*<br />
• Sue Grimmond (King’s College London, UK): 2000-2003;<br />
President, 2003-2007; Past President, 2007-2009*<br />
• Matthias Roth (National University of Singapore, Singapore):<br />
2000-2003; Secretary, 2003-2007; Acting-Treasurer<br />
2006; President, 2007-2009; Past-President 2009-2011*<br />
• Gerald Mills (UCD, Dublin, Ireland): 2007-2011; President,<br />
2009-2011<br />
• Jennifer Salmond (University of Auckland, NZ): 2005-<br />
2009; Secretary, 2007-2009<br />
• James Voogt (University of Western Ontario, Canada),<br />
2000-2006; Webmaster 2007-*; 2009-2013<br />
• Manabu Kanda (Tokyo Institute of Technology, Japan):<br />
2005-2009, ICUC-7 Local Organizer, 2007-2009.*<br />
• Andreas Christen (University of British Columbia, Canada):<br />
2012-2016<br />
• Rohinton Emmanuel (Glasgow Caledonian University,<br />
UK): 2006-2010; Secretary, 2009-2011<br />
• Jason Ching (EPA Atmospheric Modelling & Analysis Division,<br />
USA): 2009-2013<br />
• David Pearlmutter (Ben-Gurion University of the Negev,<br />
Israel): <strong>News</strong>letter Editor, 2009-*<br />
• Alberto Martilli (CIEMAT, Spain), 2010-2014<br />
• Aude Lemonsu (CNRS/Meteo France), 2010-2014<br />
• Silvana di Sabatino (Univ. of Salento, Italy), 2010-2014<br />
• Hiroyuki Kusaka (University of Tsukuba, Japan): 2011-<br />
2015<br />
• David Sailor (Portland State University, USA): 2011-2015<br />
* appointed members<br />
IAUC Committee Chairs<br />
Editor, IAUC <strong>News</strong>letter: David Pearlmutter<br />
Bibliography Committee: Matthias Demuzere<br />
Nominating Committee: Tim Oke<br />
Chair Teaching Resources: Gerald Mills<br />
Interim-Chair Awards Committee: Jennifer Salmond<br />
WebMaster: James Voogt<br />
49<br />
<strong>News</strong>letter Contributions<br />
The next edition of <strong>Urban</strong> <strong>Climate</strong> <strong>News</strong> will appear in<br />
late March. Items to be considered for the upcoming issue<br />
should be received by February 2 , 2013 and may be<br />
sent to Editor David Pearlmutter (davidp@bgu.ac.il) or to<br />
the relevant section editor:<br />
<strong>News</strong>: Winston Chow (wtchow@asu.edu)<br />
Conferences: Jamie Voogt (javoogt@uwo.ca)<br />
Bibliography: Matthias Demuzere (matthias.demuzere@<br />
ees.kuleuven.be)<br />
Projects: Sue Grimmond (Sue.Grimmond@kcl.ac.uk)<br />
Submissions should be concise and accessible to a wide audience.<br />
The articles in this <strong>News</strong>letter are unrefereed, and<br />
their appearance does not constitute formal publication;<br />
they should not be used or cited otherwise.<br />
ISSUE NO. 46 DECEMBER 2012 INTERNATIONAL ASSOCIATION FOR URBAN CLIMATE