Strategic responses to Performance Measurement in Nonprofit ...
Strategic responses to Performance Measurement in Nonprofit ...
Strategic responses to Performance Measurement in Nonprofit ...

You also want an ePaper? Increase the reach of your titles
YUMPU automatically turns print PDFs into web optimized ePapers that Google loves.
18<br />
Accord<strong>in</strong>g <strong>to</strong> Anheier and Salamon (2006) the non-profit workforce percentage is 5,9 % <strong>in</strong><br />
Germany which is above average (4,4%) but is much lower than the percentage of the <strong>to</strong>p<br />
rank<strong>in</strong>g countries, namely the Netherlands (14,4 %), Belgium (10,9 %) and Ireland (10,4 %).<br />
Accord<strong>in</strong>g <strong>to</strong> the John Hopk<strong>in</strong>s country study for Germany around 70 % of all persons<br />
employed by non-profits work <strong>in</strong> the two sec<strong>to</strong>rs chosen (Zimmer et al. 2000). Therefore the<br />
German non-profit sec<strong>to</strong>r comb<strong>in</strong>es a Western European tradition with a prom<strong>in</strong>ent role of<br />
social service providers with that of the United States, Japan, Australia and Israel where,<br />
accord<strong>in</strong>g <strong>to</strong> Anheier and Salamon (2006: 97), health care organizations are the most<br />
prom<strong>in</strong>ent ones.<br />
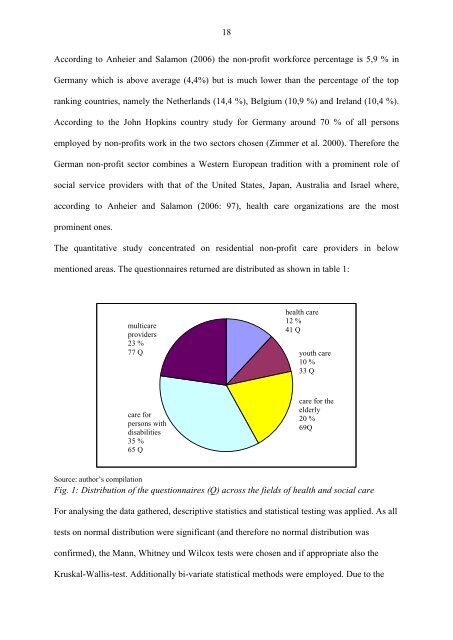
The quantitative study concentrated on residential non-profit care providers <strong>in</strong> below<br />
mentioned areas. The questionnaires returned are distributed as shown <strong>in</strong> table 1:<br />
multicare<br />
providers<br />
23 %<br />
77 Q<br />
care for<br />
persons with<br />
disabilities<br />
35 %<br />
65 Q<br />
health care<br />
12 %<br />
41 Q<br />
youth care<br />
10 %<br />
33 Q<br />
care for the<br />
elderly<br />
20 %<br />
69Q<br />
Source: author‟s compilation<br />
Fig. 1: Distribution of the questionnaires (Q) across the fields of health and social care<br />
For analys<strong>in</strong>g the data gathered, descriptive statistics and statistical test<strong>in</strong>g was applied. As all<br />
tests on normal distribution were significant (and therefore no normal distribution was<br />
confirmed), the Mann, Whitney und Wilcox tests were chosen and if appropriate also the<br />
Kruskal-Wallis-test. Additionally bi-variate statistical methods were employed. Due <strong>to</strong> the