Strategic responses to Performance Measurement in Nonprofit ...
Strategic responses to Performance Measurement in Nonprofit ...
Strategic responses to Performance Measurement in Nonprofit ...

You also want an ePaper? Increase the reach of your titles
YUMPU automatically turns print PDFs into web optimized ePapers that Google loves.
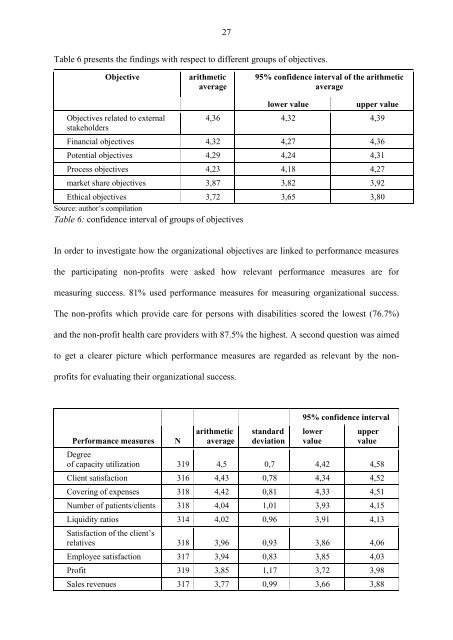
Table 6 presents the f<strong>in</strong>d<strong>in</strong>gs with respect <strong>to</strong> different groups of objectives.<br />
27<br />
Objective arithmetic<br />
average<br />
Objectives related <strong>to</strong> external<br />
stakeholders<br />
95% confidence <strong>in</strong>terval of the arithmetic<br />
average<br />
lower value upper value<br />
4,36 4,32 4,39<br />
F<strong>in</strong>ancial objectives 4,32 4,27 4,36<br />
Potential objectives 4,29 4,24 4,31<br />
Process objectives 4,23 4,18 4,27<br />
market share objectives 3,87 3,82 3,92<br />
Ethical objectives 3,72 3,65 3,80<br />
Source: author‟s compilation<br />
Table 6: confidence <strong>in</strong>terval of groups of objectives<br />
In order <strong>to</strong> <strong>in</strong>vestigate how the organizational objectives are l<strong>in</strong>ked <strong>to</strong> performance measures<br />
the participat<strong>in</strong>g non-profits were asked how relevant performance measures are for<br />
measur<strong>in</strong>g success. 81% used performance measures for measur<strong>in</strong>g organizational success.<br />
The non-profits which provide care for persons with disabilities scored the lowest (76.7%)<br />
and the non-profit health care providers with 87.5% the highest. A second question was aimed<br />
<strong>to</strong> get a clearer picture which performance measures are regarded as relevant by the non-<br />
profits for evaluat<strong>in</strong>g their organizational success.<br />
<strong>Performance</strong> measures N<br />
arithmetic<br />
average<br />
standard<br />
deviation<br />
95% confidence <strong>in</strong>terval<br />
lower<br />
value<br />
upper<br />
value<br />
Degree<br />
of capacity utilization 319 4,5 0,7 4,42 4,58<br />
Client satisfaction 316 4,43 0,78 4,34 4,52<br />
Cover<strong>in</strong>g of expenses 318 4,42 0,81 4,33 4,51<br />
Number of patients/clients 318 4,04 1,01 3,93 4,15<br />
Liquidity ratios 314 4,02 0,96 3,91 4,13<br />
Satisfaction of the client‟s<br />
relatives 318 3,96 0,93 3,86 4,06<br />
Employee satisfaction 317 3,94 0,83 3,85 4,03<br />
Profit 319 3,85 1,17 3,72 3,98<br />
Sales revenues 317 3,77 0,99 3,66 3,88