Strategic responses to Performance Measurement in Nonprofit ...
Strategic responses to Performance Measurement in Nonprofit ...
Strategic responses to Performance Measurement in Nonprofit ...

Create successful ePaper yourself
Turn your PDF publications into a flip-book with our unique Google optimized e-Paper software.
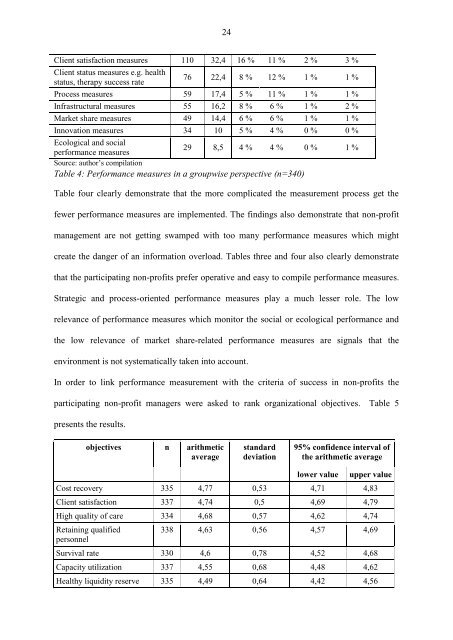
Client satisfaction measures 110 32,4 16 % 11 % 2 % 3 %<br />
Client status measures e.g. health<br />
status, therapy success rate<br />
76 22,4 8 % 12 % 1 % 1 %<br />
Process measures 59 17,4 5 % 11 % 1 % 1 %<br />
Infrastructural measures 55 16,2 8 % 6 % 1 % 2 %<br />
Market share measures 49 14,4 6 % 6 % 1 % 1 %<br />
Innovation measures 34 10 5 % 4 % 0 % 0 %<br />
Ecological and social<br />
performance measures<br />
Source: author‟s compilation<br />
29 8,5 4 % 4 % 0 % 1 %<br />
Table 4: <strong>Performance</strong> measures <strong>in</strong> a groupwise perspective (n=340)<br />
24<br />
Table four clearly demonstrate that the more complicated the measurement process get the<br />
fewer performance measures are implemented. The f<strong>in</strong>d<strong>in</strong>gs also demonstrate that non-profit<br />
management are not gett<strong>in</strong>g swamped with <strong>to</strong>o many performance measures which might<br />
create the danger of an <strong>in</strong>formation overload. Tables three and four also clearly demonstrate<br />
that the participat<strong>in</strong>g non-profits prefer operative and easy <strong>to</strong> compile performance measures.<br />
<strong>Strategic</strong> and process-oriented performance measures play a much lesser role. The low<br />
relevance of performance measures which moni<strong>to</strong>r the social or ecological performance and<br />
the low relevance of market share-related performance measures are signals that the<br />
environment is not systematically taken <strong>in</strong><strong>to</strong> account.<br />
In order <strong>to</strong> l<strong>in</strong>k performance measurement with the criteria of success <strong>in</strong> non-profits the<br />
participat<strong>in</strong>g non-profit managers were asked <strong>to</strong> rank organizational objectives. Table 5<br />
presents the results.<br />
objectives n arithmetic<br />
average<br />
standard<br />
deviation<br />
95% confidence <strong>in</strong>terval of<br />
the arithmetic average<br />
lower value upper value<br />
Cost recovery 335 4,77 0,53 4,71 4,83<br />
Client satisfaction 337 4,74 0,5 4,69 4,79<br />
High quality of care 334 4,68 0,57 4,62 4,74<br />
Reta<strong>in</strong><strong>in</strong>g qualified<br />
personnel<br />
338 4,63 0,56 4,57 4,69<br />
Survival rate 330 4,6 0,78 4,52 4,68<br />
Capacity utilization 337 4,55 0,68 4,48 4,62<br />
Healthy liquidity reserve 335 4,49 0,64 4,42 4,56