National Fuel Quality Standards Regulation Impact Statement 1 ...
National Fuel Quality Standards Regulation Impact Statement 1 ...
National Fuel Quality Standards Regulation Impact Statement 1 ...

Create successful ePaper yourself
Turn your PDF publications into a flip-book with our unique Google optimized e-Paper software.
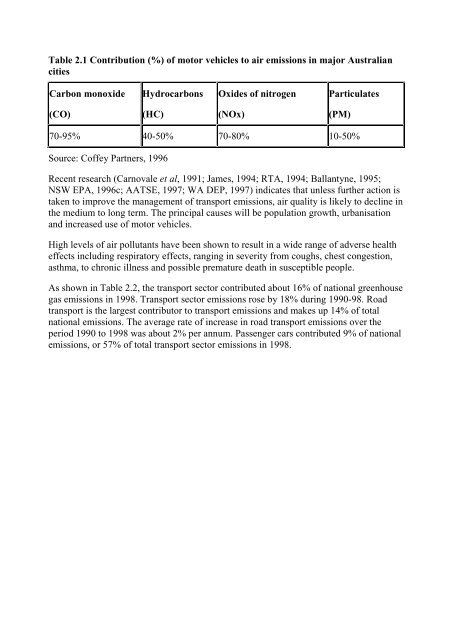
Table 2.1 Contribution (%) of motor vehicles to air emissions in major Australian<br />
cities<br />
Carbon monoxide<br />
(CO)<br />
Hydrocarbons<br />
(HC)<br />
Oxides of nitrogen<br />
(NOx)<br />
Particulates<br />
(PM)<br />
70-95% 40-50% 70-80% 10-50%<br />
Source: Coffey Partners, 1996<br />
Recent research (Carnovale et al, 1991; James, 1994; RTA, 1994; Ballantyne, 1995;<br />
NSW EPA, 1996c; AATSE, 1997; WA DEP, 1997) indicates that unless further action is<br />
taken to improve the management of transport emissions, air quality is likely to decline in<br />
the medium to long term. The principal causes will be population growth, urbanisation<br />
and increased use of motor vehicles.<br />
High levels of air pollutants have been shown to result in a wide range of adverse health<br />
effects including respiratory effects, ranging in severity from coughs, chest congestion,<br />
asthma, to chronic illness and possible premature death in susceptible people.<br />
As shown in Table 2.2, the transport sector contributed about 16% of national greenhouse<br />
gas emissions in 1998. Transport sector emissions rose by 18% during 1990-98. Road<br />
transport is the largest contributor to transport emissions and makes up 14% of total<br />
national emissions. The average rate of increase in road transport emissions over the<br />
period 1990 to 1998 was about 2% per annum. Passenger cars contributed 9% of national<br />
emissions, or 57% of total transport sector emissions in 1998.