Flathead County Transportation Plan – Phase II
Flathead County Transportation Plan – Phase II
Flathead County Transportation Plan – Phase II

Create successful ePaper yourself
Turn your PDF publications into a flip-book with our unique Google optimized e-Paper software.
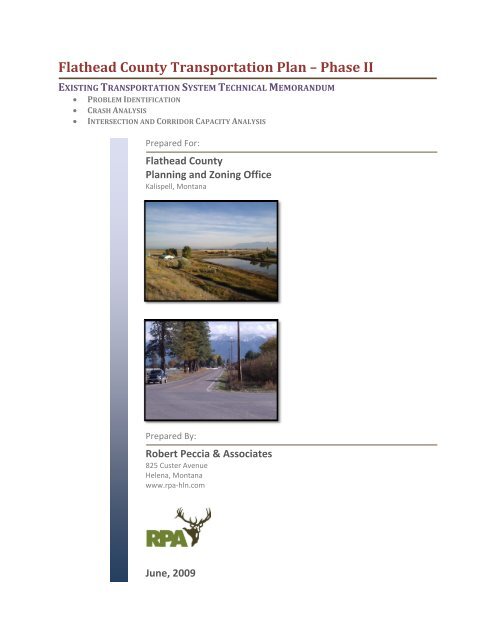
<strong>Flathead</strong> <strong>County</strong> <strong>Transportation</strong> <strong>Plan</strong> <strong>–</strong> <strong>Phase</strong> <strong>II</strong><br />
EXISTING TRANSPORTATION SYSTEM TECHNICAL MEMORANDUM<br />
PROBLEM IDENTIFICATION<br />
CRASH ANALYSIS<br />
INTERSECTION AND CORRIDOR CAPACITY ANALYSIS<br />
Prepared For:<br />
<strong>Flathead</strong> <strong>County</strong><br />
<strong>Plan</strong>ning and Zoning Office<br />
Kalispell, Montana<br />
Prepared By:<br />
Robert Peccia & Associates<br />
825 Custer Avenue<br />
Helena, Montana<br />
www.rpa‐hln.com<br />
June, 2009
<strong>Flathead</strong> <strong>County</strong> <strong>Transportation</strong> <strong>Plan</strong> <strong>–</strong> <strong>Phase</strong> <strong>II</strong><br />
EXISTING TRANSPORTATION SYSTEM TECHNICAL MEMORANDUM<br />
PROBLEM IDENTIFICATION<br />
CRASH ANALYSIS<br />
INTERSECTION AND CORRIDOR CAPACITY ANALYSIS<br />
Prepared For:<br />
<strong>Flathead</strong> <strong>County</strong><br />
<strong>Plan</strong>ning and Zoning Office<br />
Kalispell, Montana<br />
June, 2009<br />
Prepared By:<br />
Robert Peccia & Associates<br />
825 Custer Avenue<br />
Helena, Montana<br />
www.rpa‐hln.com
<strong>Flathead</strong> <strong>County</strong> <strong>Transportation</strong> <strong>Plan</strong> <strong>–</strong> <strong>Phase</strong> <strong>II</strong><br />
Chapter 2: Existing <strong>Transportation</strong> System<br />
2.1 INTRODUCTION<br />
In an effort to clearly understand the existing traffic conditions and determine potential problem areas,<br />
it was necessary to gather current information about different aspects of the transportation system.<br />
Existing traffic volume data collected by <strong>Flathead</strong> <strong>County</strong> and the Montana Department of<br />
<strong>Transportation</strong> was used to determine average daily traffic (ADT) volumes on major road segments<br />
within the county. Additional traffic data was collected by RPA during the development of the <strong>Flathead</strong><br />
<strong>County</strong> <strong>Transportation</strong> Study <strong>–</strong> <strong>Phase</strong> 1 and throughout the development of this <strong>Plan</strong>. The combination<br />
of supplied data and collected data was used to determine current operational characteristics, and to<br />
identify traffic problems that may exist or are likely to occur within the foreseeable future. Information<br />
that was gathered to help evaluate the system includes, but was not limited to, the following:<br />
Existing functional classifications;<br />
Existing traffic volumes (ADTs);<br />
Existing roadway corridor conditions;<br />
Speed data for select corridors;<br />
Intersection turning movement counts;<br />
Current intersection control types;<br />
Traffic crash records.<br />
2.2 EXISTING FUNCTIONAL CLASSIFICATIONS<br />
One of the initial steps in trying to understand an existing transportation system is to first identify what<br />
roadways will be evaluated as part of the larger planning process. A transportation system is made up<br />
of a hierarchy of roadways, with each roadway being classified by the character of service they provide.<br />
It is standard practice to examine roadways that are functionally classified as a collector, minor arterial,<br />
or principal arterial in a regional transportation plan project. These functional classifications can be<br />
encountered in both the “urban” and “rural” setting.<br />
The reasoning for examining the collector, minor arterial and principal arterial roadways, and not local<br />
roadways, is that when the major roadway system (i.e. collectors or above) is functioning to an<br />
acceptable level, than the local roadways are not used beyond their intended function. When problems<br />
begin to occur on the major roadway system, then vehicles and resulting issues begin to infiltrate<br />
neighborhood routes (i.e. local routes). As such, the overall health of a regional transportation system<br />
can be typically characterized by the health of the major roadway network.<br />
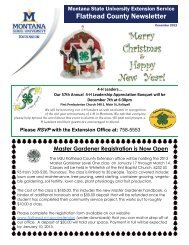
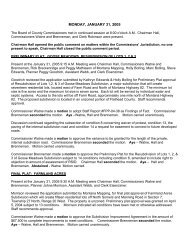
The roadways being studied under this <strong>Transportation</strong> <strong>Plan</strong>, along with the appropriate functional<br />
classifications, are shown on Figure 2.1 and Figure 2.2. It should be noted that the functional<br />
classifications shown on these figures are recommended as part of the <strong>Transportation</strong> <strong>Plan</strong> and do not<br />
reflect the “federally approved” functional classification criteria which is based on current conditions<br />
rather than anticipated future conditions. The “Federally Approved Functional Classification” system<br />
Existing <strong>Transportation</strong> System Page | 2‐1
<strong>Flathead</strong> <strong>County</strong> <strong>Transportation</strong> <strong>Plan</strong> <strong>–</strong> <strong>Phase</strong> <strong>II</strong><br />
can be seen graphically via maps available at the Montana Department of <strong>Transportation</strong>’s (MDT’s)<br />
website at the following addresses:<br />
http://www.mdt.mt.gov/other/urban_maps/fc_internet/KALISPELLFUNC.PDF (Kalispell Urban Area)<br />
http://www.mdt.mt.gov/other/urban_maps/fc_internet/WHITEFISHFUNC.PDF (Whitefish Urban Area)<br />
http://www.mdt.mt.gov/travinfo/docs/funct‐classification.pdf (State Rural Area)<br />
Roadway functional classifications within rural <strong>Flathead</strong> <strong>County</strong> include principal arterials, minor<br />
arterials, major and minor collector routes, and local/subdivision roads. The urban areas of <strong>Flathead</strong><br />
<strong>County</strong> are also served by a similar hierarchy of streets. However, due to their urban nature, the<br />
volumes on these streets are generally higher than in rural areas. Although volumes may differ on<br />
urban and rural sections of a street, it is important to maintain coordinated right‐of‐way standards to<br />
allow for efficient operation of urban development. A description of these classifications is provided in<br />
the following sections.<br />
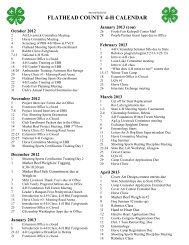
Principal Arterial System<br />
The purpose of the principal arterial is to serve the major<br />
centers of activity, the highest traffic volume corridors, and the<br />
longest trip distances. This group of roads carries a high<br />
proportion of the total traffic. Most of the vehicles entering<br />
and leaving the area, as well as most of the through traffic<br />
bypassing a central business district, utilize principal arterials.<br />
Significant intra‐area travel, such as between central business<br />
districts and outlying residential areas, and between major<br />
suburban centers, is served by principal arterials.<br />
The spacing between principal arterials may vary from less<br />
Photo 1: Highway 35 ‐ Principal Arterial<br />
than one mile in highly developed areas (e.g., the central<br />
business district), to five miles or more on the urban fringes. Principal arterials connect only to other<br />
principal arterials or to the interstate system and should not allow for direct residential driveway access.<br />
The major purpose of the principal arterial is to provide for the expedient movement of traffic. Service<br />
to abutting land is a secondary concern. Principal arterials should be public roads maintained by the<br />
MDT. Easement/right‐of‐way widths for arterials must meet MDT standards. The speed limit on a<br />
principal arterial could range from 25 to 70 mph depending on the area setting.<br />
Minor Arterial System<br />
The minor arterial street system interconnects with and works in conjunction with the principal arterial<br />
system. It accommodates trips of moderate length at a somewhat lower level of travel mobility than<br />
principal arterials, and it distributes travel to smaller geographic areas. With an emphasis on traffic<br />
mobility, this network includes all arterials not classified as principal arterials. While minor arterials<br />
provide access to adjacent lands, direct residential driveway access should not be allowed.<br />
2‐2 | P age Existing <strong>Transportation</strong> System
The spacing of minor arterial streets may vary from several<br />
blocks to a half‐mile in the highly developed areas, to several<br />
miles in the suburban fringes. They are not normally spaced<br />
more than one mile apart in fully developed areas.<br />
Minor arterials should be public county or state roads.<br />
Easement/right‐of‐way widths for state minor arterials must<br />
meet MDT’s standards. Easement/right‐of‐way widths for<br />
county minor arterials must meet <strong>Flathead</strong> <strong>County</strong>’s standards.<br />
Posted speed limits on minor arterials would typically range<br />
between 25 and 70 mph, depending on the setting.<br />
Collector System<br />
<strong>Flathead</strong> <strong>County</strong> <strong>Transportation</strong> <strong>Plan</strong> <strong>–</strong> <strong>Phase</strong> <strong>II</strong><br />
The collector street network serves a dual purpose. It provides<br />
equal priority to the movement of traffic, and to the access of<br />
residential, business, and industrial areas. This type of roadway<br />
differs from those of the arterial system in that collector<br />
roadways may access residential neighborhoods. The collector<br />
system affords easy access to the arterial system and<br />
distributes trips from the arterials to ultimate destinations.<br />
The collector streets also collect traffic from local streets in the<br />
residential neighborhoods, channeling it into the arterial<br />
system. Posted speed limits on urban collectors typically range<br />
Photo 3: West Valley Drive ‐ Major Collector<br />
between 25 and 45 mph; rural collector speed limits can range<br />
from 25 to 70 mph depending on setting and roadway surfacing.<br />
Collectors penetrate but should not have continuity through<br />
residential neighborhoods. Direct residential driveway access<br />
onto collector streets is typically not allowed. The actual<br />
location of collectors should be flexible to best serve<br />
developing areas and the public.<br />
Photo 2: Whitefish Stage ‐ Minor Arterial<br />
The most important concept is that long segments of<br />
continuous collector streets are not compatible with a good<br />
functional classification of streets. Long, continuous collectors<br />
will encourage through traffic, essentially turning them into<br />
arterials. This, in turn, results in the undesirable interface of Photo 4: Batavia Lane ‐ Minor Collector<br />
local streets with arterials, causing safety problems and<br />
increased costs of construction and maintenance. The collector street system should intersect arterial<br />
streets at a uniform spacing of one to one‐quarter mile in order to maintain good progression on the<br />
arterial network. Ideally, collectors should be no longer than one to two miles without discontinuities.<br />
Collectors are typically dedicated to the public and maintained by the county.<br />
Collectors are divided into two categories: minor and major. ADT determines whether a collector is<br />
minor or major; minor collectors generally serve less than 1000 ADT.<br />
Existing <strong>Transportation</strong> System Page | 2‐3
<strong>Flathead</strong> <strong>County</strong> <strong>Transportation</strong> <strong>Plan</strong> <strong>–</strong> <strong>Phase</strong> <strong>II</strong><br />
Unclassified Roads<br />
Unclassified roads are all facilities not included in one of the higher systems. These roadways may<br />
function as minor collectors, local roads or subdivision roads and their classification is determined on a<br />
case‐by‐case basis.<br />
Subdivision Road System<br />
Photo 5: Winchester Street ‐ Local / Subdivision Street<br />
The subdivision road network provides direct access to<br />
residential, commercial or industrial lots, or other abutting<br />
lands, and connections to higher order systems. These roads<br />
typically service subdivisions and through‐traffic movement is<br />
typically discouraged. Subdivision roads may be internal,<br />
located on the perimeter, or external to the subdivision. The<br />
minimum easement/right‐of‐way width for a subdivision road is<br />
generally 60 feet. The speed limit on subdivision roads is usually<br />
25 mph or less.<br />
2‐4 | P age Existing <strong>Transportation</strong> System
Lincoln<br />
Sanders<br />
DRAFT<br />
93<br />
2<br />
<strong>Flathead</strong><br />
Glacier<br />
89<br />
Pondera<br />
Lake Teton<br />
SEE DETAIL<br />
FIGURE 2.2<br />
FIGURE 2.1<br />
FUNCTIONAL CLASSIFICATION OF EXISTING FACILITIES<br />
<strong>Flathead</strong> <strong>County</strong> <strong>Transportation</strong> <strong>Plan</strong> - <strong>Phase</strong> <strong>II</strong><br />
LEGEND<br />
Detail Area<br />
Study Area Boundary<br />
<strong>County</strong> Boundary<br />
City Boundary<br />
Future US 93 Bypass<br />
Functional Classification<br />
Principal Arterial<br />
Minor Arterial<br />
Major Collector<br />
Minor Collector<br />
Unclassified Road<br />
0 1.25 2.5 5<br />
Miles<br />
Note: The functional classifications shown are recommended as<br />
part of the <strong>Transportation</strong> <strong>Plan</strong> and do not reflect the federally<br />
approved functional classification criteria which is based on<br />
current conditions rather than anticipated future conditions.
Lincoln<br />
Sanders<br />
DRAFT<br />
93<br />
2<br />
<strong>Flathead</strong><br />
Glacier<br />
89<br />
Pondera<br />
Lake Teton<br />
FIGURE 2.2<br />
FUNCTIONAL CLASSIFICATION OF EXISTING FACILITIES - DETAIL<br />
<strong>Flathead</strong> <strong>County</strong> <strong>Transportation</strong> <strong>Plan</strong> - <strong>Phase</strong> <strong>II</strong><br />
Note: The functional classifications shown are recommended as<br />
part of the <strong>Transportation</strong> <strong>Plan</strong> and do not reflect the federally<br />
approved functional classification criteria which is based on<br />
current conditions rather than anticipated future conditions.<br />
LEGEND<br />
Detail Area<br />
Functional Classification<br />
Principal Arterial<br />
City Boundary<br />
Minor Arterial<br />
Major Collector<br />
Future US 93 Bypass<br />
Minor Collector<br />
Unclassified Roadway<br />
0 0.5 1 2 3<br />
Miles
<strong>Flathead</strong> <strong>County</strong> <strong>Transportation</strong> <strong>Plan</strong> <strong>–</strong> <strong>Phase</strong> <strong>II</strong><br />
2.3 CORRIDOR VOLUMES, CAPACITY AND LEVELS OF SERVICE<br />
When evaluating a street system, it is good practice to compare the traffic volumes to the approximate<br />
capacity of each road. Traffic volumes collected by MDT, <strong>Flathead</strong> <strong>County</strong>, and Robert Peccia and<br />
Associates (RPA) were used to determine current traffic conditions, and to provide reliable data on<br />
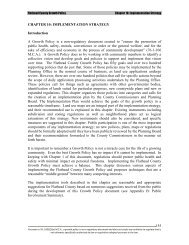
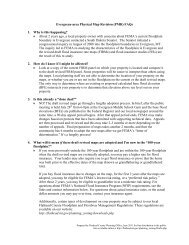
historic traffic volumes. The most recent average daily traffic (ADT) counts available on major road<br />
segments within the community were used. This information is shown on Figure 2.3 and 2.4. After<br />
identifying the current traffic volumes, the existing road network was examined to determine the<br />
current size of the major routes. This information is presented on Figure 2.5 and 2.6.<br />
The capacity of a roadway is based on a number of features including functional classification, roadway<br />
width, number of approaches along the facility, whether the road is urban or rural, speed limit, etc. For<br />
planning purposes, all of these variables are taken into account and over time general planning values<br />
have been established that approximate the number of vehicles per day that can be accommodated on<br />
a given roadway section.<br />
Rural roadway corridors are somewhat unique from their urban counterparts in that oftentimes,<br />
excessive traffic volumes are not the primary issue governing travel operations. For the more rural<br />
roadways, issues such as sight distance, passing zones and travel speeds usually ride to the forefront.<br />
Regarding rural roadways, there are some general planning level guidelines that are often relied upon<br />
when comparing the theoretical capacity of a roadway to its existing traffic volumes.<br />
The maximum number of vehicles that could theoretically be accommodated on a roadway is greater<br />
than the number typically acceptable in <strong>Flathead</strong> <strong>County</strong>. Thus, for the purposes of this <strong>Transportation</strong><br />
<strong>Plan</strong>, the concept of “acceptable” capacity has been used as the threshold for defining roadway<br />
capacity.<br />
Comparison of the “acceptable” capacity against existing or anticipated future volumes can assist in<br />
determining if a roadway is under capacity, at capacity, or over capacity. The general recommended<br />
acceptable roadway capacities are shown below in Table 2.1 and are broken out based on functional<br />
classification and roadway type.<br />
Table 2.1: Recommended Acceptable Daily Roadway Capacity<br />
Capacity (vehicles / day) 1<br />
Roadway Type<br />
Rural<br />
Collector<br />
Minor Arterial /<br />
Urban Collector<br />
Principal<br />
Arterial<br />
Two Lane Road 6,000 9,000 12,000<br />
Three Lane Road 9,000 13,500 18,000<br />
Four Lane Road 12,000 18,000 24,000<br />
Five Lane Road 17,500 26,250 35,000<br />
1 Values represent theoretical planning level capacities developed for this <strong>Transportation</strong> <strong>Plan</strong>.<br />
Actual capacity can vary greatly depending on access control, cross‐street volumes, and peaking characteristics.<br />
Roadway LOS is determined based on a combination of factors all of which play a part in the driver’s<br />
perception of how the roadway is performing. When drivers experience delays due to reduced travel<br />
speeds, lack of passing opportunities, heavy vehicles in the traffic stream, and steep roadway grades,<br />
the roadway LOS deteriorates. As was done for roadway capacity, a less complicated look at roadway<br />
Existing <strong>Transportation</strong> System Page | 2‐7
<strong>Flathead</strong> <strong>County</strong> <strong>Transportation</strong> <strong>Plan</strong> <strong>–</strong> <strong>Phase</strong> <strong>II</strong><br />
LOS can be used for planning purposes. The relationship between the roadway volume and the<br />
theoretical capacity of the roadway can be used to determine the corresponding LOS for that corridor.<br />
Table 2.2 below shows these corresponding values.<br />
Table 2.2: Roadway LOS and V/C Ratios<br />
LOS Rank Description V/C Ratio<br />
A<br />
B<br />
C<br />
D<br />
E<br />
F<br />
Source: Highway Capacity Manual; <strong>Transportation</strong> Research Board, 2000<br />
Represents free‐flow conditions. Individual users are virtually unaffected by the<br />
presence of others in the traffic stream. Freedom to select speeds and to maneuver<br />
within the traffic stream is extremely high. The general level of comfort and<br />
convenience provided to drivers is excellent.<br />
Also allows speeds at or near free‐flow speeds, but the presence of other users<br />
begins to be noticeable. Freedom to select speeds is relatively unaffected, but<br />
there is a slight decline in the freedom to maneuver within the traffic stream<br />
relative to LOS A.<br />
Has speeds at or near free‐flow speeds, but the freedom to maneuver is noticeably<br />
restricted (lane changes require careful attention on the part of the drivers). The<br />
general level of comfort and convenience declines significantly at this level.<br />
Disruptions in the traffic stream, such as an incident (for example, vehicular crash or<br />
disablement), can result in significant queue formation and vehicular delay. In<br />
contrast, the effects of incidents at LOS A or LOS B are minimal, with only minor<br />
delay in the immediate vicinity of the event.<br />
Represents the conditions where speeds begin to decline slightly with increasing<br />
flow. The freedom to maneuver becomes more restricted, and drivers experience<br />
reductions in physical and psychological comfort. Incidents can generate lengthy<br />
queues because the higher density associated with the LOS provides little or no<br />
space to absorb disruptions in traffic flow.<br />
Represents operating conditions at or near the roadway’s capacity. Even minor<br />
disruptions to the traffic stream, such as vehicles entering from a ramp or vehicles<br />
changing lanes, can cause delays as other vehicles give way to allow such<br />
maneuvers. In general, maneuverability is extremely limited, and drivers<br />
experience considerable physical and psychological discomfort.<br />
Describes a breakdown in vehicular flow. Queues form quickly behind points in the<br />
roadway where the arrival flow rate temporarily exceeds the departure rate, as<br />
determined by the roadway’s capacity. Such points occur at incidents and on‐ and<br />
off‐ramps, where incoming traffic results in capacity being exceeded. Vehicles<br />
typically operate at low speeds under these conditions and are often required to<br />
come to a complete stop, usually in a cyclic fashion. The cyclic formation and<br />
dissipation of queues is a key characterization of LOS F.<br />
2‐8 | P age Existing <strong>Transportation</strong> System<br />
< 0.60<br />
≥ 0.60 and < 0.70<br />
≥ 0.70 and < 0.80<br />
≥ 0.80 and < 0.90<br />
≥ 0.90 and < 1.00<br />
The LOS of a roadway can be improved by either increasing the capacity or decreasing the traffic<br />
volume. To increase the capacity, improvements must be made along the roadway to increase its ability<br />
≥ 1.00
<strong>Flathead</strong> <strong>County</strong> <strong>Transportation</strong> <strong>Plan</strong> <strong>–</strong> <strong>Phase</strong> <strong>II</strong><br />
to handle traffic. Reducing traffic volumes is difficult but may be achieved by providing an alternate<br />
travel route or by implementing traffic calming techniques.<br />
It should be noted that most <strong>Flathead</strong> <strong>County</strong> roads are well under the 6,000 vehicles per day (vpd)<br />
threshold previously established for rural collector or arterial roads without left‐turn bays and generally<br />
function at a LOS of C or better. As future development occurs in the <strong>County</strong>, traffic volumes will<br />
ultimately rise and may approach or exceed these thresholds which will ultimately result in decreased<br />
LOS.<br />
As a matter of reference, a residential lot within a new subdivision will generally add approximately 10<br />
vehicle trips per day on the adjacent roadway system. As an example, a 100‐lot residential subdivision<br />
will generate approximately 1000 vehicles per day on the adjacent roadway. While these trips will<br />
distribute themselves on other roadways in the area as they get farther and farther away from the<br />
development site, the added trips will have the maximum impacts on the road (or roads) directly<br />
adjacent to the development area.<br />
Existing <strong>Transportation</strong> System Page | 2‐9
Lincoln<br />
Sanders<br />
DRAFT<br />
93<br />
2<br />
<strong>Flathead</strong><br />
Glacier<br />
89<br />
Pondera<br />
Lake Teton<br />
SEE DETAIL<br />
FIGURE 2.4<br />
FIGURE 2.3<br />
EXISTING ADT TRAFFIC VOLUMES<br />
<strong>Flathead</strong> <strong>County</strong> <strong>Transportation</strong> <strong>Plan</strong> - <strong>Phase</strong> <strong>II</strong><br />
561<br />
2550<br />
LEGEND<br />
Study Area Boundary<br />
<strong>County</strong> Boundary<br />
City Boundary<br />
Detail Boundary<br />
Future US 93 Bypass<br />
Local Roadway<br />
< 1,000<br />
1,000 - 5,000<br />
5,000 - 10,000<br />
> 10,000<br />
<strong>County</strong> ADT<br />
MDT ADT<br />
0 1.25 2.5 5<br />
Miles
Lincoln<br />
Sanders<br />
DRAFT<br />
93<br />
2<br />
<strong>Flathead</strong><br />
Glacier<br />
89<br />
Pondera<br />
Lake Teton<br />
FIGURE 2.4<br />
EXISTING ADT TRAFFIC VOLUMES - DETAIL<br />
<strong>Flathead</strong> <strong>County</strong> <strong>Transportation</strong> <strong>Plan</strong> - <strong>Phase</strong> <strong>II</strong><br />
561<br />
2550<br />
<strong>County</strong> ADT<br />
MDT ADT<br />
LEGEND<br />
Detail Area<br />
City Limits<br />
Future US 93 Bypass<br />
< 1,000<br />
1,000 - 5,000<br />
5,000 - 10,000<br />
> 10,000<br />
Local Roadway<br />
0 0.5 1 2 3<br />
Miles
Lincoln<br />
Sanders<br />
DRAFT<br />
93<br />
2<br />
<strong>Flathead</strong><br />
Glacier<br />
89<br />
Pondera<br />
Lake Teton<br />
SEE DETAIL<br />
FIGURE 2.6<br />
FIGURE 2.5<br />
EXISTING CORRIDOR FACILITY SIZE<br />
<strong>Flathead</strong> <strong>County</strong> <strong>Transportation</strong> <strong>Plan</strong> - <strong>Phase</strong> <strong>II</strong><br />
LEGEND<br />
Study Area Boundary<br />
<strong>County</strong> Boundary<br />
City Boundary<br />
Detail Boundary<br />
Future US 93 Bypass<br />
Local Roadway<br />
2-Lane<br />
3-Lane<br />
4-Lane<br />
5-Lane<br />
0 1.25 2.5 5<br />
Miles
Lincoln<br />
Sanders<br />
DRAFT<br />
93<br />
2<br />
<strong>Flathead</strong><br />
Glacier<br />
89<br />
Pondera<br />
Lake Teton<br />
FIGURE 2.6<br />
EXISTING CORRIDOR SIZE - DETAIL<br />
<strong>Flathead</strong> <strong>County</strong> <strong>Transportation</strong> <strong>Plan</strong> - <strong>Phase</strong> <strong>II</strong><br />
Detail Area<br />
City Limits<br />
LEGEND<br />
Future US 93 Bypass<br />
Local Roadway<br />
2-Lane<br />
3-Lane<br />
4-Lane<br />
5-Lane<br />
0 0.5 1 2 3<br />
Miles
<strong>Flathead</strong> <strong>County</strong> <strong>Transportation</strong> <strong>Plan</strong> <strong>–</strong> <strong>Phase</strong> <strong>II</strong><br />
2.4 EXISTING INTERSECTION LEVELS OF SERVICE<br />
Road systems are ultimately controlled by the function of the major intersections. Intersection failure<br />
directly reduces the number of vehicles that can be accommodated during the peak hours, which have<br />
the highest demand, and the total daily capacity of a corridor. As a result of this strong impact on<br />
corridor function, intersection improvements can be a very cost‐effective means of increasing a<br />
corridor’s traffic volume capacity. In some circumstances, corridor expansion projects may be able to be<br />
delayed with correct intersection improvements.<br />
Due to the significant portion of total expense for road construction projects used for project design,<br />
construction, mobilization, and adjacent area rehabilitation, a careful analysis must be made of the<br />
expected service life from intersection‐only improvements. If adequate design life can be achieved with<br />
only improvements to the intersection, then a corridor expansion may not be the most efficient<br />
solution. With that in mind, it is important to determine how well the major intersections are<br />
functioning by determining their Level of Service.<br />
Intersection LOS is a qualitative measure developed by the transportation profession to quantify driver<br />
perception for such elements as travel time, number of stops, total amount of stopped delay, and<br />
impediments caused by other vehicles. It provides a scale that is intended to match the motorists’<br />
perception of the operation of the intersection. LOS provides a means for identifying intersections that<br />
are experiencing operational difficulties, as well as providing a scale to compare intersections with each<br />
other.<br />
The LOS scale represents the full range of operating conditions. This scale is based on the ability of an<br />
intersection or street segment to accommodate the amount of traffic using it. As was the case with<br />
corridor LOS, the scale ranges from “A” which indicates little, if any, vehicle delay, to “F” which indicates<br />
significant vehicle delay and traffic congestion. Table 2.3 on the following page gives a description of<br />
each LOS ranking along with delay thresholds for signalized and unsignalized intersections.<br />
Intersection counts were conducted during the fall of 2006 as part of the <strong>Phase</strong> 1 LOS analysis. Each<br />
intersection was counted between 7:00 AM to 9:00 AM and 4:00 PM to 6:00 PM to ensure that the<br />
intersection’s peak volumes were represented. Based upon this data, the operational characteristics of<br />
each intersection were determined. The LOS analysis contained in this section was conducted according<br />
to the procedures outlined in the <strong>Transportation</strong> Research Board’s Highway Capacity Manual <strong>–</strong> Special<br />
Report 209 using the Highway Capacity Software, version 4.1 f.<br />
2‐14 | P age Existing <strong>Transportation</strong> System
Table 2.3: Intersection Level of Service Criteria<br />
LOS Rank Description<br />
Source: Highway Capacity Manual; <strong>Transportation</strong> Research Board, 2000<br />
Traffic moves freely, low volumes accompany the free flow<br />
condition. At signalized intersections, progression is extremely<br />
favorable, and most vehicles arrive during the green phase. Most<br />
vehicles do not stop at all. At unsignalized intersections, nearly all<br />
drivers find freedom of operation with very little time spent<br />
waiting for an acceptable gap. Very seldom is there more than one<br />
vehicle in queue.<br />
Traffic moves fairly freely, volumes are somewhat low. At<br />
signalized intersections, there is good progression and/or short<br />
cycle lengths. Vehicles generally clear on one green phase. At<br />
unsignalized intersections, some drivers begin to consider the<br />
average control delay an inconvenience, but acceptable gaps are<br />
still very easy to find. Occasionally there is more than one vehicle<br />
in queue.<br />
Traffic moves smoothly, volumes are beginning to increase. At<br />
signalized intersections, higher delays may result from fair<br />
progression and/or longer cycle lengths. Individual cycle failures<br />
may begin to appear at this level. The number of vehicles stopping<br />
is significant, although many still pass through the intersection<br />
without stopping. At unsignalized intersections, average control<br />
delay becomes noticeable to most drivers, even though acceptable<br />
gaps are found on a regular basis. It is not uncommon for an<br />
arriving driver to find a standing queue of at least one additional<br />
vehicle.<br />
Traffic approaching unstable flow, the influence of congestion<br />
becomes more noticeable. At signalized intersections, longer<br />
delays may result from some combination of unfavorable<br />
progression, long cycle length, or high volume/capacity ratios.<br />
Many vehicles stop, and the proportion of vehicles not stopping<br />
declines. Individual cycle failures are noticeable. At unsignalized<br />
intersections, average control delay is long enough to be an<br />
irritation to most drivers. Acceptable gaps are hard to find<br />
because there is a standing queue of vehicles already waiting when<br />
the driver arrives.<br />
Unstable traffic flow, volumes at or near capacity. At signalized<br />
intersections, the high delays generally indicate poor progression,<br />
long cycle lengths, and high volume/capacity ratios. Individual<br />
cycle failures are frequent occurrences. At unsignalized<br />
intersections, drivers find the length of the average control delay<br />
approaching intolerable levels. Acceptable gaps are hard to find<br />
because there is a standing queue of vehicles already waiting when<br />
the driver arrives.<br />
Saturation condition, volumes are over capacity. This is considered<br />
to be unacceptable to most drivers. This condition occurs with<br />
oversaturation. At signalized intersections, it may occur at high<br />
volume/capacity ratios with many individual cycle failures. Poor<br />
progression and long cycle lengths may also contribute to such<br />
high delay values. At unsignalized intersections, delays are high<br />
because acceptable gaps are hard to find. Acceptable gaps are<br />
hard to find because there is a standing queue of vehicles already<br />
waiting when the driver arrives.<br />
<strong>Flathead</strong> <strong>County</strong> <strong>Transportation</strong> <strong>Plan</strong> <strong>–</strong> <strong>Phase</strong> <strong>II</strong><br />
Average Delay per Vehicle (sec)<br />
Signalized<br />
Intersections<br />
Unsignalized<br />
Intersections<br />
< 10 < 10<br />
10 to 20 10 to 15<br />
20 to 35 15 to 25<br />
35 to 50 25 to 35<br />
50 to 80 35 to 50<br />
> 80 > 50<br />
Existing <strong>Transportation</strong> System Page | 2‐15
<strong>Flathead</strong> <strong>County</strong> <strong>Transportation</strong> <strong>Plan</strong> <strong>–</strong> <strong>Phase</strong> <strong>II</strong><br />
2.4.1 SIGNALIZED INTERSECTIONS<br />
The procedures used to evaluate signalized intersections use detailed information on geometry, lane<br />
use, signal timing, peak hour volumes, arrival types and other parameters. This information is then used<br />
to calculate delays and determine the capacity of each intersection. Generally, an intersection is<br />
determined to be functioning adequately if operating at LOS C or better.<br />
For signalized intersections, recent research has determined that “average control delay” per vehicle is<br />
the best available measure of level of service. The amount of control delay that a vehicle experiences<br />
is approximately equal to the time elapsed from when a vehicle joins a queue at the intersection (or<br />
arrives at the stop line when there is no queue) until the vehicle departs from the stopped position at<br />
the head of the queue. Control delay takes into account uniform delay, incremental delay, and initial<br />
queue delay. The control delay is primarily a function of volume, capacity, cycle length, green ratio, and<br />
the pattern of vehicle arrivals. Table 2.3 defines LOS in terms of average control delay per vehicle.<br />
The intersection of Fairmont Road and MT Highway 35 is the only signalized intersection specifically<br />
analyzed as part of this <strong>Transportation</strong> <strong>Plan</strong>. This intersection was recently signalized on a temporary<br />
basis and the data collection at this location occurred while the intersection was still unsignalized. Table<br />
2.4 shows the LOS analysis completed for this intersection using an assumed signal timing. Under<br />
unsignalized conditions, this intersection had a failing LOS and met signalization warrants. For more<br />
information on this intersection and other intersections that were evaluated in detail, see Section 2.7.2.<br />
Signalized Intersection<br />
Table 2.4: Existing Level of Service for Signalized Intersections<br />
AM Peak Hour PM Peak Hour<br />
Delay LOS V/C Delay LOS V/C<br />
MT Highway 35 / Fairmont Road 1 11.10 B 0.69 8.70 A 0.59<br />
Eastbound Left / Thru / Right 5.00 A 0.32 8.70 A 0.68<br />
Westbound Left / Thru / Right 12.40 B 0.80 5.20 A 0.36<br />
Northbound Left / Thru / Right 32.00 C 0.21 32.00 C 0.21<br />
Southbound Left / Thru / Right 30.40 C 0.00 30.90 C 0.06<br />
1 Signal timing was assumed and may not reflect actual signal timing.<br />
2.4.2 UNSIGNALIZED INTERSECTIONS<br />
Unsignalized intersections include two‐way stop‐controlled (TWSC) and all‐way stop‐controlled (AWSC)<br />
intersections. The LOS for an AWSC type intersection is computed in the same way as signalized<br />
intersections and is based on the average control delay per vehicle at the intersection. Since there is no<br />
major street, the highest delay could be experienced by any of the approaching streets.<br />
TWSC type intersection LOS values are computed in a manner different than signalized and AWSC type<br />
intersections. The LOS for a TWSC intersection is generally not defined for the intersection as a whole,<br />
but rather is determined by the delay experienced for each individual minor street approach. However,<br />
for the purposes of this <strong>Plan</strong>, and to gauge the overall intersection performance, the LOS for a TWSC was<br />
based on the average delay experienced along the minor street approaches. This difference from the<br />
method used for signalized intersections is necessary since the operating characteristics of a stop‐<br />
2‐16 | P age Existing <strong>Transportation</strong> System
<strong>Flathead</strong> <strong>County</strong> <strong>Transportation</strong> <strong>Plan</strong> <strong>–</strong> <strong>Phase</strong> <strong>II</strong><br />
controlled intersection are substantially different. Driver expectations and perceptions are also entirely<br />
different.<br />
For TWSC intersections, through traffic on the major (uncontrolled) street only experiences delay if the<br />
lane includes a combined left‐turn. If there is a designated left‐turn lane along the major street, the<br />
through and right‐turn movements do not directly experience delay at the intersection. Conversely,<br />
vehicles turning left from the minor street experience more delay than other movements and at times<br />
can experience significant delay. Vehicles on the minor street, which are turning right or going across<br />
the major street, experience less delay than those turning left from the same approach. Table 2.3 on<br />
the previous page shows the criteria used to determine the LOS for both signalized and unsignalized<br />
intersections.<br />
Using the guidelines discussed previously, the data collected in the fall of 2006, and calculation<br />
techniques for TWSC and AWSC type intersections, the LOS was calculated for fifteen unsignalized<br />
intersections. The results of this analysis are shown in Table 2.5 below. The intersection LOS is also<br />
shown graphically in Figure 2.7 and 2.8. A more detailed analysis of each of these intersections is given<br />
in Section 2.7.2.<br />
Table 2.5: Unsignalized Intersection Level of Service (Existing Conditions) 1<br />
Unsignalized Intersection<br />
AM Peak Hour PM Peak Hour<br />
Delay LOS V/C Delay LOS V/C<br />
Auction Road / Demersville Road 8.7 A ‐ 8.8 A ‐<br />
Northbound Left / Thru 7.2 A 0.00 7.3 A 0.01<br />
Eastbound Left / Right 8.7 A 0.03 8.8 A 0.01<br />
Batavia Lane / US Highway 2 33.9 D ‐ 17.1 C ‐<br />
Northbound Left 8.1 A 0.06 8.6 A 0.03<br />
Eastbound Left / Right 33.9 D 0.65 17.1 C 0.34<br />
Beach Drive / Holt Drive 9.7 A ‐ 10.7 B ‐<br />
Eastbound Left / Thru / Right 7.5 A 0.00 7.5 A 0.00<br />
Westbound Left / Thru / Right 7.4 A 0.00 7.6 A 0.01<br />
Northbound Left / Thru 10.2 B 0.00 11.3 B 0.01<br />
Northbound Right 9.0 A 0.01 9.2 A 0.01<br />
Southbound Left / Thru / Right 10.2 B 0.01 11.3 B 0.00<br />
Best Way / Truck Route (AWSC) 8.05 A ‐ 7.75 A ‐<br />
Eastbound Left / Thru / Right 7.39 A ‐ 7.35 A ‐<br />
Westbound Left / Thru / Right 8.42 A ‐ 8.00 A ‐<br />
Northbound Left / Thru / Right 8.04 A ‐ 7.66 A ‐<br />
Southbound Left / Thru / Right 8.16 A ‐ 8.12 A ‐<br />
Columbia Falls Stage / Kelley Road 9.9 A ‐ 9.5 A ‐<br />
Eastbound Left / Thru 7.6 A 0.09 7.4 A 0.05<br />
Southbound Left / Right 9.9 A 0.08 9.5 A 0.11<br />
Helena Flats Road / East Evergreen Drive 12.2 B ‐ 11.6 B ‐<br />
Northbound Left / Thru / Right 7.6 A 0.03 7.7 A 0.02<br />
Southbound Left / Thru / Right 7.6 A 0.00 7.6 A 0.00<br />
Westbound Left / Thru / Right 13.0 B 0.06 11.5 B 0.02<br />
Eastbound Left / Thru / Right 11.4 B 0.12 11.6 B 0.10<br />
Helena Flats Road / East Reserve Drive (AWSC) 8.44 A ‐ 9.45 A ‐<br />
Eastbound Left / Thru / Right 8.03 A ‐ 9.52 A ‐<br />
Existing <strong>Transportation</strong> System Page | 2‐17
<strong>Flathead</strong> <strong>County</strong> <strong>Transportation</strong> <strong>Plan</strong> <strong>–</strong> <strong>Phase</strong> <strong>II</strong><br />
Unsignalized Intersection<br />
AM Peak Hour PM Peak Hour<br />
Delay LOS V/C Delay LOS V/C<br />
Westbound Left / Thru / Right 8.32 A ‐ 8.68 A ‐<br />
Northbound Left / Thru / Right 9.02 A ‐ 10.00 A ‐<br />
Southbound Left / Thru / Right 7.94 A ‐ 8.58 A ‐<br />
Hodgson Road / Whitefish Stage 10.3 B ‐ 11.9 B ‐<br />
Northbound Left / Thru / Right 7.3 A 0.01 7.4 A 0.02<br />
Southbound Left / Thru / Right 7.5 A 0.01 7.5 A 0.02<br />
Westbound Left / Thru / Right 10.1 B 0.09 12.0 B 0.16<br />
Eastbound Left / Thru / Right 10.4 B 0.13 11.7 B 0.16<br />
Kila Road / US Highway 2 10.7 B ‐ 9.6 A ‐<br />
Southbound Left / Thru 8.0 A 0.07 7.9 A 0.10<br />
Westbound Left / Right 10.7 B 0.14 9.6 A 0.07<br />
West Springcreek Road / US Highway 2 60.5 F ‐ 24.5 C ‐<br />
Eastbound Left / Thru / Right 8.0 A 0.08 8.8 A 0.04<br />
Westbound Left / Thru / Right 9.1 A 0.01 7.9 A 0.02<br />
Northbound Left / Thru / Right 26.6 D 0.24 25.3 D 0.18<br />
Southbound Left / Thru / Right 94.4 F 0.90 23.7 C 0.39<br />
West Valley Drive / Three Mile Drive 9.8 A ‐ 9.8 A ‐<br />
Eastbound Left / Thru / Right 7.2 A 0.00 7.3 A 0.00<br />
Westbound Left / Thru / Right 7.3 A 0.01 7.2 A 0.01<br />
Northbound Left / Thru / Right 9.6 A 0.09 9.8 A 0.10<br />
Southbound Left / Thru / Right 10.0 A 0.10 9.8 A 0.10<br />
Whitefish Stage / Granrud Lane 14.2 B ‐ 14.1 B ‐<br />
Northbound Left / Thru 8.2 A 0.00 8.2 A 0.01<br />
Eastbound Left / Right 14.2 B 0.10 14.1 B 0.04<br />
Whitefish Stage / Mission Trail 16.3 C ‐ 17.4 C ‐<br />
Southbound Left / Thru 7.9 A 0.00 8.1 A 0.01<br />
Westbound Left / Right 16.3 C 0.18 17.4 C 0.12<br />
Whitefish Stage / West Evergreen Drive 15.1 C ‐ 133.7 F ‐<br />
Southbound Left / Thru 7.9 A 0.04 9.2 A 0.22<br />
Westbound Left / Right 15.1 C 0.34 133.7 F 1.11<br />
Whitefish Stage / Winchester Street 19.1 C ‐ 21.1 C ‐<br />
Northbound Left / Thru / Right 8.5 A 0.00 8.1 A 0.00<br />
Southbound Left / Thru / Right 8.0 A 0.01 8.5 A 0.01<br />
Westbound Left / Thru / Right 24.2 C 0.35 22.4 C 0.13<br />
Eastbound Left / Thru / Right 14.0 B 0.03 19.8 C 0.30<br />
1 Intersection LOS for two‐way stop‐controlled intersections is based on average delay along minor approach legs.<br />
The LOS analyses of the existing conditions for these study intersections reveals that a few unsignalized<br />
intersections are currently functioning at LOS D or lower. These intersections are ideal candidates for<br />
closer examination and potential intersection improvement measures.<br />
It should be noted that it is not unusual for an unsignalized intersection to experience a poor LOS due to<br />
conditions for the minor street left‐turn movement. It should be understood that, often this poor LOS is<br />
experienced by a small minority of the total number of vehicles at the intersection and that the<br />
intersection as a whole may operate acceptably. Therefore, LOS along the minor street approach may<br />
be representative of only a small percentage of the total vehicles utilizing the intersection. A more<br />
detailed analysis should be completed to determine how the intersection functions as a whole.<br />
2‐18 | P age Existing <strong>Transportation</strong> System
Lincoln<br />
Sanders<br />
DRAFT<br />
93<br />
2<br />
<strong>Flathead</strong><br />
Glacier<br />
89<br />
B A<br />
Pondera<br />
Lake Teton<br />
SEE DETAIL<br />
FIGURE 2.8<br />
B B<br />
FIGURE 2.7<br />
EXISTING INTERSECTION LEVEL OF SERVICE<br />
<strong>Flathead</strong> <strong>County</strong> <strong>Transportation</strong> <strong>Plan</strong> - <strong>Phase</strong> <strong>II</strong><br />
A B<br />
A A<br />
B B<br />
1. Auction Road and Demersville Road<br />
2. Batavia Lane and US Highway 2<br />
3. Beach Drive and Holt Drive<br />
4. Best Way and Truck Route<br />
5. Columbia Falls Stage Road and Kelley Road<br />
6. Fairmont Road and MT Highway 35<br />
7. Helena Flats Road and East Evergreen Drive<br />
8. Helena Flats Road and East Reserve Drive<br />
STUDY INTERSECTIONS<br />
LEGEND<br />
Detail Area<br />
Study Area Boundary<br />
<strong>County</strong> Boundary<br />
City Boundary<br />
On-System Route<br />
Off-System Route<br />
Future US 93 Bypass<br />
Unsignalized Intersection<br />
B A<br />
AM PM<br />
Signalized Intersection<br />
B A<br />
AM PM<br />
A, B, C, D, E, F = Level of Service<br />
0 1.25 2.5 5<br />
Miles<br />
9. Hodgson Road and Whitefish Stage Road<br />
10. Kila Road and US Highway 2<br />
11. West Springcreek Road and US Highway 2<br />
12. West Valley Drive and Three Mile Drive<br />
13. Whitefish Stage Road and Granrud Lane<br />
14. Whitefish Stage Road and Mission Trail<br />
15. Whitefish Stage Road and West Evergreen Drive<br />
16. Whitefish Stage Road and Winchester Street
Lincoln<br />
Sanders<br />
DRAFT<br />
93<br />
2<br />
<strong>Flathead</strong><br />
D C<br />
Glacier<br />
89<br />
A A<br />
Pondera<br />
Lake Teton<br />
F D<br />
1. Auction Road and Demersville Road<br />
2. Batavia Lane and US Highway 2<br />
3. Beach Drive and Holt Drive<br />
4. Best Way and Truck Route<br />
5. Columbia Falls Stage Road and Kelley Road<br />
6. Fairmont Road and MT Highway 35<br />
7. Helena Flats Road and East Evergreen Drive<br />
8. Helena Flats Road and East Reserve Drive<br />
C C<br />
B B<br />
C F<br />
C C<br />
A A<br />
FIGURE 2.8<br />
EXISTING INTERSECTION LEVEL OF SERVICE - DETAIL<br />
<strong>Flathead</strong> <strong>County</strong> <strong>Transportation</strong> <strong>Plan</strong> - <strong>Phase</strong> <strong>II</strong><br />
STUDY INTERSECTIONS<br />
Detail Area<br />
City Boundary<br />
Future US 93 Bypass<br />
On-System Route<br />
Off-System Route<br />
9. Hodgson Road and Whitefish Stage Road<br />
10. Kila Road and US Highway 2<br />
11. West Springcreek Road and US Highway 2<br />
12. West Valley Drive and Three Mile Drive<br />
13. Whitefish Stage Road and Granrud Lane<br />
14. Whitefish Stage Road and Mission Trail<br />
15. Whitefish Stage Road and West Evergreen Drive<br />
16. Whitefish Stage Road and Winchester Street<br />
A A<br />
B B<br />
LEGEND<br />
B A<br />
Unsignalized Intersection<br />
B A<br />
AM PM<br />
Signalized Intersection<br />
B A<br />
AM PM<br />
A, B, C, D, E, F = Level of Service<br />
0 0.5 1 2 3<br />
Miles
2.5 SIGNAL WARRANT ANALYSIS<br />
<strong>Flathead</strong> <strong>County</strong> <strong>Transportation</strong> <strong>Plan</strong> <strong>–</strong> <strong>Phase</strong> <strong>II</strong><br />
A signal warrant analysis was conducted to determine if any of the existing unsignalized intersections<br />
listed in Table 2.5 with levels of service of D or lower met signal warrants. According to the 2003 Edition<br />
of the Manual on Uniform Traffic Control Devices (MUTCD), there are eight signal warrants that must be<br />
analyzed for the installation of a traffic control signal. The MUTCD states that a traffic signal should not<br />
be installed unless one or more warrants are satisfied. The eight signal warrants that must be analyzed<br />
are as follows:<br />
1. Eight‐Hour Vehicular Volume <strong>–</strong> This warrant is intended for application at locations where a<br />
large volume of intersection traffic is the principal reason to consider the installation of a traffic<br />
signal (Condition A) or where the traffic volume on the major street is so heavy that traffic on<br />
the minor street experiences excessive delay or conflict in entering or crossing the major street<br />
(Condition B) during any eight hours of an average day. The criteria for Warrant 1 may be met if<br />
either Condition A or Condition B is met. The combination of Condition A and B are not<br />
required. This warrant was not analyzed due to insufficient project data.<br />
2. Four‐Hour Vehicular Volume <strong>–</strong> This warrant is intended for locations where the volume of<br />
intersecting traffic is the principal reason to consider installing a traffic control signal. This<br />
warrant requires that the combination of the major‐street traffic (total of both approaches) and<br />
the higher‐volume minor‐street traffic (one direction only) reach the designated MUTCD volume<br />
during any four hours of an average day. This warrant was based upon a combination of AM<br />
and PM peak hour volumes to account for the four‐hour period. This warrant was met for two<br />
of the intersections analyzed as shown in Table 2.6.<br />
3. Peak Hour <strong>–</strong> This warrant is intended for use at a location where during any one hour of an<br />
average day, the minor‐street traffic suffers undue delay when entering or crossing the major<br />
street. This warrant also requires that the combination of the major‐street traffic (total of both<br />
approaches) and the higher‐volume minor‐street traffic (one direction only) reach the<br />
designated MUTCD volume. The peak hour warrant was conducted assuming that this peak<br />
hour would fall within the peak periods. This warrant was met for three of the intersections<br />
analyzed as shown in Table 2.6.<br />
4. Pedestrian Volume <strong>–</strong> The Pedestrian Volume signal warrant is intended for application where<br />
the traffic volume on a major street is so heavy that pedestrians experience excessive delay in<br />
crossing the major street. This warrant was not analyzed due to insufficient project data.<br />
5. School Crossing <strong>–</strong> This warrant addresses the unique characteristics that a nearby school may<br />
have on the roadways. It requires that the major roadway be unsafe to cross and that there are<br />
no other feasible crossings in the area. This warrant was not analyzed due to insufficient project<br />
data.<br />
6. Coordinated Signal System <strong>–</strong> Progressive movement in a coordinated signal system sometimes<br />
necessitates installing traffic control signals at intersections where they would not otherwise be<br />
needed in order to maintain proper platooning of vehicles. This warrant was not met for any of<br />
the intersections under consideration.<br />
Existing <strong>Transportation</strong> System Page | 2‐21
<strong>Flathead</strong> <strong>County</strong> <strong>Transportation</strong> <strong>Plan</strong> <strong>–</strong> <strong>Phase</strong> <strong>II</strong><br />
7. Crash Experience <strong>–</strong> The Crash Experience signal warrant conditions are intended for application<br />
where the severity and frequency of crashes are the principal reasons to consider installing a<br />
traffic control signal. This warrant was not analyzed due to insufficient project data.<br />
8. Roadway Network <strong>–</strong> This warrant is intended for locations where the installation of a traffic<br />
signal may encourage concentration and organization of traffic flow on a roadway network. This<br />
warrant was not met for any of the intersections under consideration.<br />
Ideally, before considering a signal for traffic control at an intersection, it is desirable to meet more than<br />
one signal warrant. A detailed analysis of an intersection that meets at least one signal warrant should<br />
be completed to determine if less restrictive traffic controls, or possible geometric modifications, would<br />
benefit the operational characteristics of the intersection. Intersections meeting multiple signal<br />
warrants may be candidates for signalization, but must be analyzed carefully to consider the major and<br />
minor street traffic movements and volumes. As is shown in Table 2.6, all three intersections analyzed<br />
appear to meet one or more traffic signal warrants based upon the preliminary warrant analysis and<br />
thus could be considered for traffic signal control going forward.<br />
Table 2.6: Signal Warrant Analysis (Existing Unsignalized Intersections)<br />
Intersection<br />
LOS Signal Warrant<br />
AM PM #2 #3 #6 #8<br />
Batavia Lane / US Highway 2 D C X X<br />
West Springcreek Road / US Highway 2 F D X X<br />
Whitefish Stage / West Evergreen Drive C F X<br />
Since vehicular delay and the frequency of some types of crashes are sometimes greater under traffic<br />
signal control than under STOP sign control, consideration should be given to providing alternatives to<br />
traffic control signals, even if one or more of the signal warrants has been satisfied. Some of the<br />
available alternatives may include, but are not limited to, the following:<br />
Installing signs along the major street to warn road users approaching the intersection;<br />
Relocating the stop line(s) and making other changes to improve the sight distance at the<br />
intersection;<br />
Installing measures designed to reduce speeds on the approaches;<br />
Installing a flashing beacon at the intersection to supplement STOP sign control;<br />
Installing flashing beacons on warning signs in advance of a STOP sign controlled intersection on<br />
major‐ and/or minor‐street approaches;<br />
Adding one or more lanes on a minor‐street approach to reduce the number of vehicles per lane<br />
on the approach;<br />
Revising the geometrics at the intersection to channelize vehicular movements and reduce the<br />
time required for a vehicle to complete a movement, which could also assist pedestrians;<br />
Installing roadway lighting if a disproportionate number of crashes occur at night;<br />
Restricting one or more turning movements, perhaps on a time‐of‐day basis, if alternate routes<br />
are available;<br />
If the warrant is satisfied, installing multi‐way STOP sign control;<br />
Installing a roundabout; and<br />
Employing other alternatives, depending on conditions at the intersection.<br />
2‐22 | P age Existing <strong>Transportation</strong> System
2.6 SAFETY AND CRASH ANALYSIS<br />
<strong>Flathead</strong> <strong>County</strong> <strong>Transportation</strong> <strong>Plan</strong> <strong>–</strong> <strong>Phase</strong> <strong>II</strong><br />
The MDT Traffic and Safety Bureau provided crash information and data for use in the <strong>Flathead</strong> <strong>County</strong><br />
<strong>Transportation</strong> <strong>Plan</strong> <strong>–</strong> <strong>Phase</strong> <strong>II</strong>. The crash information was analyzed to identify potential problem areas<br />
along corridors and at intersections and was also used to indicate areas that may warrant further study.<br />
General crash characteristics and potential roadway deficiencies were determined through the crash<br />
analysis. Specific corridors and intersections that have been identified as problem areas during this time<br />
period were determined and are evaluated in more detail in Section 2.7 of this <strong>Plan</strong>.<br />
The crash information covers a three‐year time period from January 1 st , 2004 to December 31 st , 2006. It<br />
should be noted that reconfiguration projects around the <strong>County</strong> during this time period were not taken<br />
into account in this analysis.<br />
2.6.1 CORRIDOR ANALYSIS<br />
Twelve study corridors were evaluated as part of this crash analysis. Problem areas were identified at<br />
locations along the corridor that have an unusually high number of crashes in certain locations. Section<br />
2.7.1 provides more detail about the areas where potential safety problems exist. The following<br />
locations along the study corridors appear to have an unusually high number of crashes:<br />
Church Drive<br />
o Intersection with US Highway 93<br />
o 90 degree corners along the corridor<br />
Columbia Falls Stage / River Road<br />
o Intersection of Columbia Falls Stage and River Road<br />
o Intersection with Hellman Lane<br />
o Intersection with Kelley Road<br />
East Reserve Drive<br />
o Between Ash Road and US Highway 2<br />
o Intersection with US Highway 2<br />
Foothills Road<br />
o At or near Jewel Basin Road<br />
o Between Peters Creek Way and Bachelor Grade Road<br />
o North of Snowberry Trail<br />
Helena Flats Road<br />
o Intersection with MT Highway 35<br />
Hodgson Road<br />
o Intersection with US Highway 2<br />
o Between Hare Trail and Lidstrom Road<br />
o Intersection with US Highway 2<br />
o Intersection with Whitefish Stage<br />
Kila Road<br />
o Intersection with US Highway 2<br />
Lower Valley Road<br />
o At or near intersection with Foys Bend Lane<br />
o Along other sharp corners<br />
Existing <strong>Transportation</strong> System Page | 2‐23
<strong>Flathead</strong> <strong>County</strong> <strong>Transportation</strong> <strong>Plan</strong> <strong>–</strong> <strong>Phase</strong> <strong>II</strong><br />
2.6.2 INTERSECTION CRASH ANALYSIS<br />
Sixteen intersections were evaluated as part of this crash analysis. Three analyses were performed to<br />
rank these sixteen intersections based on different crash characteristics. These three analysis measures<br />
and their results are described in this section.<br />
First, the intersections were ranked by number of crashes. A summary of these intersections, along with<br />
the number of crashes at each intersection, is shown in Table 2.7. The intersections at which no<br />
reported crashes occurred were not analyzed further as part of this crash analysis.<br />
Table 2.7: Number of Crashes at Intersections (Jan 1, 2004 ‐ Dec 31, 2006)<br />
Intersection Type 1<br />
Crashes<br />
Hodgson Road / Whitefish Stage U‐2W 6<br />
West Springcreek Road / US Highway 2 U‐2W 6<br />
Kila Road / US Highway 2 U‐2W 5<br />
Fairmont Road / MT Highway 35 2 U‐2W 4<br />
West Valley Drive / Three Mile Drive U‐2W 3<br />
Whitefish Stage / West Evergreen Drive U‐1W 3<br />
Batavia Lane / US Highway 2 U‐2W 2<br />
Helena Flats Road / East Evergreen Drive U‐2W 2<br />
Whitefish Stage / Granrud Lane U‐1W 2<br />
Columbia Falls Stage / Kelley Road U‐2W 1<br />
Auction Road / Demersville Road U‐2W 0<br />
Beach Drive / Holt Drive U‐2W 0<br />
Best Way / Truck Route U‐4W 0<br />
Helena Flats Road / East Reserve Drive U‐2W 0<br />
Whitefish Stage / Mission Trail U‐1W 0<br />
Whitefish Stage / Winchester Street U‐1W 0<br />
1 “U‐1W" = Unsignalized one‐way stop control; "U‐2W" = Unsignalized two‐way stop control; "U‐4W" = Unsignalized four‐way stop control.<br />
2 This intersection was signalized after the crash data collection and analysis was completed.<br />
The second crash analysis performed involved a more detailed look at the crashes to determine the MDT<br />
“severity index rating”. Crashes were broken out into three categories of severity: property damage<br />
only (PDO), other injury crash, and fatality or incapacitating injury. Each of these three types is given a<br />
different rating: one (1) for a PDO crash; three (3) for a non‐incapacitating injury crash; eight (8) for a<br />
fatality or incapacitating injury crash. The MDT severity index rating for each intersection in the analysis<br />
is shown in Table 2.8. The calculation used to arrive at the severity index rating is shown below.<br />
[(# PDO) x (1)] + [(# Non‐Incapacitating Crashes) x (3)]<br />
+ [(# Fatalities or Incapacitating Crashes) x (8)]<br />
Total Number of Crashes in a Three‐Year Period<br />
= (MDT Severity Index Rating)<br />
2‐24 | P age Existing <strong>Transportation</strong> System
<strong>Flathead</strong> <strong>County</strong> <strong>Transportation</strong> <strong>Plan</strong> <strong>–</strong> <strong>Phase</strong> <strong>II</strong><br />
Table 2.8: Intersection Crash Analysis ‐ MDT Severity Index Rating<br />
Intersection PDO Injury Fatality / Incap. Severity Index<br />
Whitefish Stage / Granrud Lane 1 0 1 4.50<br />
Batavia Lane / US Highway 2 0 2 0 3.00<br />
West Springcreek Road / US Highway 2 1 5 0 2.67<br />
West Valley Drive / Three Mile Drive 1 2 0 2.33<br />
Whitefish Stage / West Evergreen Drive 1 2 0 2.33<br />
Kila Road / US Highway 2 2 3 0 2.20<br />
Fairmont Road / MT Highway 35 2 2 0 2.00<br />
Helena Flats Road / East Evergreen Drive 1 1 0 2.00<br />
Hodgson Road / Whitefish Stage 4 2 0 1.67<br />
Columbia Falls Stage / Kelley Road 1 0 0 1.00<br />
The third analysis ranked the number of crashes against the average daily traffic (ADT) at each<br />
intersection, expressed in crashes per million entering vehicles (MEV). A summary of the intersections<br />
in the analysis is shown in Table 2.9. The calculation used to arrive at the crash rates is as follows:<br />
Total Number of Crashes in a Three‐Year Period<br />
(AADT for Intersection) x (3 years) x (365 days/year) / (1,000,000 vehicles)<br />
Table 2.9: Intersection Crash Analysis ‐ Crash Rate<br />
Intersection Crashes Volume 1<br />
Crash Rate<br />
West Valley Drive / Three Mile Drive 3 1,427 1.92<br />
Hodgson Road / Whitefish Stage 6 3,239 1.69<br />
Kila Road / US Highway 2 5 4,778 0.96<br />
West Springcreek Road / US Highway 2 6 8,821 0.62<br />
Columbia Falls Stage / Kelley Road 1 1,667 0.55<br />
Helena Flats Road / East Evergreen Drive 2 3,838 0.48<br />
Fairmont Road / MT Highway 35 4 10,863 0.34<br />
Whitefish Stage / West Evergreen Drive 3 9,949 0.28<br />
Whitefish Stage / Granrud Lane 2 7,000 0.26<br />
Batavia Lane / US Highway 2 2 7,991 0.23<br />
1 Volume determined using turning movement counts collected for this <strong>Plan</strong>.<br />
= (Crash Rate)<br />
In order to give the intersections included in the crash analysis a comparable rating, a composite rating<br />
score was developed based on the three analyses presented previously. The intersections were ranked<br />
based on their position on each of the three previous tables, giving each equal weight. For example, the<br />
intersection of West Valley Drive and Three Mile Drive was given a ranking of 5 for its position in Table<br />
2.7, another ranking of 4 for its position in Table 2.8, and a ranking of 1 for its ranking in Table 2.9. Thus<br />
its composite rating is 10. Refer to Table 2.10 for the composite rating of each intersection.<br />
Existing <strong>Transportation</strong> System Page | 2‐25
<strong>Flathead</strong> <strong>County</strong> <strong>Transportation</strong> <strong>Plan</strong> <strong>–</strong> <strong>Phase</strong> <strong>II</strong><br />
Table 2.10: Intersection Crash Analysis Composite Rating<br />
Intersection Crash Severity Crash Rate Composite<br />
West Springcreek Road / US Highway 2 1 3 4 8<br />
West Valley Drive / Three Mile Drive 5 4 1 10<br />
Hodgson Road / Whitefish Stage 1 9 2 12<br />
Kila Road / US Highway 2 3 6 3 12<br />
Whitefish Stage / Granrud Lane 7 1 9 17<br />
Whitefish Stage / West Evergreen Drive 5 4 8 17<br />
Fairmont Road / MT Highway 35 4 7 7 18<br />
Batavia Lane / US Highway 2 7 2 10 19<br />
Helena Flats Road / East Evergreen Drive 7 7 6 20<br />
Columbia Falls Stage / Kelley Road 10 10 5 25<br />
The top problematic intersections as identified through the composite rating score method may warrant<br />
further study and may be in need of mitigation measures to specifically address crash trends. Each of<br />
the sixteen intersections studied in this crash analysis were analyzed in more detail in Section 2.7.2.<br />
2‐26 | P age Existing <strong>Transportation</strong> System
2.7 STUDY CORRIDORS AND INTERSECTIONS<br />
<strong>Flathead</strong> <strong>County</strong> <strong>Transportation</strong> <strong>Plan</strong> <strong>–</strong> <strong>Phase</strong> <strong>II</strong><br />
This section provides information about the existing conditions of the twelve corridors and sixteen<br />
intersections that were evaluated in detail as part of this <strong>Transportation</strong> <strong>Plan</strong>. Each study intersection<br />
and corridor was analyzed to identify areas where problems currently exist or potentially may exist in<br />
the future. The crash analysis, LOS analysis and capacity levels contained in the previous sections were<br />
also used to help identify potentially deficient areas.<br />
All of the sixteen study intersections and ten of the twelve study corridors evaluated in this Chapter<br />
were also evaluated in the <strong>Flathead</strong> <strong>County</strong> <strong>Transportation</strong> Study ‐ <strong>Phase</strong> 1. Figure 2.9 shows the<br />
location of the study corridors and intersections.<br />
2.7.1 STUDY CORRIDORS<br />
The corridors discussed in this section were evaluated in detail and are shown in Figure 2.9. All other<br />
roads within the study area were not individually evaluated but rather were analyzed as elements of the<br />
transportation system as a whole. These study corridors were chosen based on their importance to the<br />
roadway network, known traffic patterns, accessibility, and community desire. Information collected<br />
along these corridors includes signage, intersection control, surfacing conditions, drainage, sight<br />
distances, crash data, and other factors that may contribute to the performance of the corridor. The<br />
following twelve corridors were evaluated:<br />
1. Ashley Lake Road <strong>–</strong> US Highway 2 to North Ashley Lake Road<br />
2. Church Drive (not evaluated in <strong>Phase</strong> 1) <strong>–</strong> US Highway 93 to Bald Rock Road<br />
3. Columbia Falls Stage / River Road <strong>–</strong> MT Highway 35 to US Highway 2<br />
4. East Reserve Drive <strong>–</strong> US Highway 2 to Helena Flats Road<br />
5. Foothills Road <strong>–</strong> Lake Blaine Road to Echo Lake Road<br />
6. Helena Flats Road <strong>–</strong> MT Highway 35 to East Reserve Drive<br />
7. Hodgson Road <strong>–</strong> US Highway 93 to US Highway 2<br />
8. Holt Stage Road / Mennonite Church Road <strong>–</strong> Steel Bridge Road to Mennonite Church Road<br />
9. Kila Road <strong>–</strong> North intersection with US Highway 2 to south intersection with US Highway 2<br />
10. Lake Blaine Road <strong>–</strong> MT Highway 35 to Hemler Creek Drive<br />
11. Lower Valley Road (not evaluated in <strong>Phase</strong> 1) <strong>–</strong> Willow Glen Drive to MT Highway 82<br />
12. Spring Hill Road <strong>–</strong> Smith Lake Road to its end<br />
Existing <strong>Transportation</strong> System Page | 2‐27
Lincoln<br />
Sanders<br />
DRAFT<br />
93<br />
2<br />
<strong>Flathead</strong><br />
Ashley<br />
Lake Road<br />
Glacier<br />
89<br />
Kila<br />
Road<br />
Pondera<br />
Lake Teton<br />
10<br />
2<br />
Church<br />
Drive<br />
12<br />
11<br />
Spring<br />
Hill Road<br />
13<br />
14<br />
9<br />
Hodgson<br />
Road<br />
15<br />
16<br />
East Reserve<br />
Drive<br />
8<br />
7 6<br />
Holt<br />
Stage Road<br />
FIGURE 2.9<br />
STUDY CORRIDORS AND INTERSECTIONS<br />
<strong>Flathead</strong> <strong>County</strong> <strong>Transportation</strong> <strong>Plan</strong> - <strong>Phase</strong> <strong>II</strong><br />
1<br />
4<br />
5<br />
Helena<br />
Flats Road<br />
Mennonite<br />
Church Road<br />
River<br />
Road<br />
Lower<br />
Valley Road<br />
Columbia Falls<br />
Stage Road<br />
Lake Blaine Road<br />
Foothills<br />
Road<br />
1. Auction Road and Demersville Road<br />
2. Batavia Lane and US Highway 2<br />
3. Beach Drive and Holt Drive<br />
4. Best Way and Truck Route<br />
5. Columbia Falls Stage Road and Kelley Road<br />
6. Fairmont Road and MT Highway 35<br />
7. Helena Flats Road and East Evergreen Drive<br />
8. Helena Flats Road and East Reserve Drive<br />
3<br />
STUDY INTERSECTIONS<br />
LEGEND<br />
Study Area Boundary<br />
<strong>County</strong> Boundary<br />
City Boundary<br />
On System Route<br />
Off System Route<br />
Future US 93 Bypass<br />
Study Corridor<br />
Study Intersection<br />
0 1.25 2.5 5<br />
Miles<br />
9. Hodgson Road and Whitefish Stage Road<br />
10. Kila Road and US Highway 2<br />
11. West Springcreek Road and US Highway 2<br />
12. West Valley Drive and Three Mile Drive<br />
13. Whitefish Stage Road and Granrud Lane<br />
14. Whitefish Stage Road and Mission Trail<br />
15. Whitefish Stage Road and West Evergreen Drive<br />
16. Whitefish Stage Road and Winchester Street
1. Ashley Lake Road<br />
Ashley Lake Road was evaluated from the intersection with US<br />
Highway 2 north to the intersection of North Ashley Lake Road<br />
and Ashley Lake Road. Ashley Lake Road is a two‐lane gravel<br />
roadway classified as a minor collector and has little to no<br />
shoulder. This roadway is used to access recreational areas<br />
around Ashley Lake in addition to serving residential areas<br />
along the corridor. The speed limit along Ashley Lake Road is<br />
35 mph.<br />
<strong>Flathead</strong> <strong>County</strong> <strong>Transportation</strong> <strong>Plan</strong> <strong>–</strong> <strong>Phase</strong> <strong>II</strong><br />
A speed study was conducted by RPA along Ashley Lake Road in August 2008, approximately 4.4 miles<br />
north of US Highway 2. The speed study showed an average speed of 35.9 mph and an 85 th percentile<br />
speed of 42.8 mph. As the speed study shows, the average speed is close to the speed limit, while the<br />
85 th percentile speed is almost 8 mph higher than the posted speed limit. Generally it is desirable to<br />
have an 85 th percentile speed within 5 mph of the posted speed limit. The high 85 th percentile speed<br />
along Ashley Lake Road indicates that there may be a speeding problem at the study location.<br />
Table 2.11 shows various ADT counts conducted along the study corridor by <strong>Flathead</strong> <strong>County</strong>, MDT, and<br />
RPA. These ADT counts show that current traffic volumes are well under theoretical capacity levels for a<br />
two‐lane roadway and are also under the suggested roadway paving threshold value of 400 vehicles per<br />
day (vpd). As traffic increases in the future, these volumes may reach or exceed this paving trigger.<br />
Table 2.11: Ashley Lake Road ADT<br />
Source Location Date ADT<br />
<strong>County</strong> North of US 2 Aug‐03 232<br />
MDT 0.5 miles north of US 2 2004 200<br />
RPA 1 4.4 miles north of US 2 Aug‐08 191<br />
1 Represents single day ADT count; value was not adjusted for seasonal or daily variation.<br />
There were five crashes reported along the study area of Ashley Lake Road between January 1 st , 2004<br />
and December 31 st , 2006. Four out of the five crashes reported involved only one vehicle, the majority<br />
of which occurred along the shoulder of the roadway. No fatalities or injuries were reported as a result<br />
of any of the crashes.<br />
In general, Ashley Lake Road has had very few crashes along the study corridor. An analysis of the crash<br />
data shows that most of the crashes are likely due to users driving too fast for the conditions and as a<br />
result, running off the road. The roadway is gravel and the majority of the crashes were due to drivers<br />
overcorrecting and rolling over into the ditch. There appears to be no pattern of where the crashes are<br />
taking place. The crash analysis does not identify specific deficient areas that are directly resulting in<br />
unsafe conditions along the study corridor.<br />
Identified Issues<br />
Future ADTs may reach paving threshold<br />
No shoulders and limited sight distance<br />
Potential speeding<br />
Photo 6: Ashley Lake Road<br />
Existing <strong>Transportation</strong> System Page | 2‐29
<strong>Flathead</strong> <strong>County</strong> <strong>Transportation</strong> <strong>Plan</strong> <strong>–</strong> <strong>Phase</strong> <strong>II</strong><br />
2. Church Drive<br />
Church Drive was evaluated from the intersection with US<br />
Highway 93 west to the intersection with Bald Rock Road.<br />
Church Drive is a two‐lane paved roadway classified as a minor<br />
arterial between US Highway 93 and Secondary 424 and as a<br />
minor collector west of Secondary 424. This corridor was not<br />
evaluated as part of the <strong>Phase</strong> 1 plan.<br />
Church Drive has no shoulder and has a posted speed limit of<br />
35 mph. The corridor provides residential access to the area<br />
and also serves to provide connection to US Highway 93 and<br />
Photo 7: Church Drive<br />
Secondary 424. The surrounding area generally consists of<br />
fields, some of which are expected to see future commercial and/or residential development. As the<br />
area grows, it is expected that Church Drive will see a dramatic increase in traffic volumes, particularly<br />
east of West Springcreek Road.<br />
Table 2.12 below shows ADT counts conducted by <strong>Flathead</strong> <strong>County</strong> along various portions of the study<br />
corridor. These ADT counts show that current traffic volumes are well under theoretical capacity levels<br />
for a two‐lane roadway.<br />
Table 2.12: Church Drive ADT<br />
Source Location Date ADT<br />
<strong>County</strong> East of Secondary 424 Sep‐07 457<br />
<strong>County</strong> East of Stillwater Road Sep‐03 593<br />
<strong>County</strong> South of Prairie View Road May‐01 568<br />
<strong>County</strong> West of Bald Rock Road Jun‐02 138<br />
<strong>County</strong> West of Secondary 424 Sep‐07 222<br />
<strong>County</strong> West of Stillwater Road Sep‐03 571<br />
<strong>County</strong> West of US Highway 93 Jul‐06 790<br />
There were sixteen reported crashes along the study area of Church Drive between January 1 st , 2004<br />
and December 31 st , 2006. Of these sixteen crashes, ten involved only one vehicle, the majority of which<br />
occurred along the shoulder of the roadway. Seven of the crashes occurred when the roadway surfacing<br />
conditions were dry. Eight crashes resulted in injury, none of which were incapacitating or resulted in<br />
fatalities.<br />
Of the sixteen reported crashes, five occurred at the intersection with US Highway 93. At the time of<br />
these crashes, this intersection had stop control along Church Drive. This intersection is presently being<br />
constructed to incorporate a “junior interchange” along with the reconstruction of US Highway 93 to a<br />
5‐lane roadway. It is expected that the safety of this intersection will improve as a result of the<br />
intersection being reconstructed.<br />
A number of crashes also occurred at or near one of the 90‐degree corners along Church Drive. These<br />
sharp corners can be difficult to navigate, especially in adverse weather conditions and may prove to be<br />
increasingly dangerous as traffic volumes increase along Church Drive.<br />
2‐30 | P age Existing <strong>Transportation</strong> System
<strong>Flathead</strong> <strong>County</strong> <strong>Transportation</strong> <strong>Plan</strong> <strong>–</strong> <strong>Phase</strong> <strong>II</strong><br />
The crash analysis completed along Church Drive indicates that there is a general problem regarding the<br />
safety of the multiple 90‐degree corners present along the corridor. The relatively low traffic volumes<br />
that currently exist along Church Drive (particularly along the western section of the corridor) help keep<br />
the total number of crashes along the corridor low; however, as development occurs in the area, and as<br />
traffic volumes ultimately increase along Church Drive, the corridor may prove to be even less safe than<br />
current crash trends currently indicate.<br />
The intersection of Prairie View Drive and Church Drive is of particular concern. This is a standard three‐<br />
legged intersection with stop‐control along the eastern leg of Church Drive. The concern with this<br />
intersection is that the majority of the traffic occurs along the southern and eastern Church Drive<br />
approach legs. This creates a problem with priority at the intersection due to the current signing and<br />
geometric configuration of the intersection. Also, while traveling northbound along Church Drive it is<br />
difficult to see this intersection due to the trees and foliage along the southeastern corner. These<br />
concerns will become more of an issue as traffic volumes continue to increase as development occurs in<br />
the area.<br />
Identified Issues<br />
Lack of advance warning signing for curves<br />
Future ADTs may create hazardous conditions along the 90‐degree curves<br />
No shoulders<br />
Areas with steep side slopes<br />
Worn pavement markings<br />
Intersection with Prairie View Drive has inadequate signing and priority<br />
3. Columbia Falls Stage / River Road<br />
This corridor was evaluated from the intersection US Highway<br />
2 south to the intersection with MT Highway 35. River Road<br />
runs from the intersection with US Highway 2 southwest<br />
approximately 0.75 miles to intersect with Columbia Falls<br />
Stage; Columbia Falls Stage runs from the intersection with<br />
River Road south to intersect with MT Highway 35. The study<br />
corridor is a two‐lane paved roadway classified as a major<br />
collector and is approximately 10.75 miles long.<br />
This corridor mainly serves a variety of residential<br />
Photo 8: Columbia Falls Stage<br />
neighborhoods and provides access to some recreational areas<br />
along the <strong>Flathead</strong> River. The corridor also provides an alternate north/south connection to Secondary<br />
206 between Columbia Falls and Kalispell east of the <strong>Flathead</strong> River.<br />
The pavement and striping is generally in good condition; however, the lack of shoulders is problematic<br />
along areas with steep side slopes. There are also a number of short vertical curves that result in<br />
decreased sight distances. The speed limit along Columbia Falls Stage is 45 mph south of Trap Road and<br />
35 mph north of Trap Road. The speed limit of River Road is 35 mph.<br />
Existing <strong>Transportation</strong> System Page | 2‐31
<strong>Flathead</strong> <strong>County</strong> <strong>Transportation</strong> <strong>Plan</strong> <strong>–</strong> <strong>Phase</strong> <strong>II</strong><br />
A speed study was conducted by RPA along Columbia Falls Stage approximately 0.5 miles north of<br />
Sullivan Crossroad in August, 2008. The speed study showed an average speed of 57.0 mph and an 85 th<br />
percentile speed of 66.8 mph. The average speed is 12 mph higher than the posted speed limit, while<br />
the 85 th percentile speed is more than 20 mph higher than the posted speed limit. As the speed study<br />
indicates, there is excessive speeding occurring along Columbia Falls Stage which can result in unsafe<br />
conditions along the corridor.<br />
Table 2.13 shows various ADT counts conducted by <strong>Flathead</strong> <strong>County</strong> and RPA along the study corridor.<br />
These ADT values are well under theoretical capacity levels for a paved two‐lane major collector<br />
roadway.<br />
Table 2.13: Columbia Falls Stage ADT<br />
Source Location Date ADT<br />
<strong>County</strong> North of Badrock Drive Jul‐01 691<br />
<strong>County</strong> North of Gosney Crossroad Jul‐01 792<br />
<strong>County</strong> North of Kelley Road Jul‐04 1,919<br />
<strong>County</strong> North of MT 35 Oct‐07 1,591<br />
<strong>County</strong> North of Trap Road Jul‐01 706<br />
<strong>County</strong> South of Helman Lane Jul‐04 796<br />
<strong>County</strong> West of Kelley Road Sep‐02 1,170<br />
<strong>County</strong> East of Columbia Falls Stage Jul‐04 2,395<br />
<strong>County</strong> South of US 2 Aug‐06 2,450<br />
RPA 1 0.5 Miles north of Sullivan Crossroad Aug‐08 852<br />
1 Represents single day ADT count; value was not adjusted for seasonal or daily variation.<br />
There were twenty‐seven reported crashes along Columbia Falls Stage between January 1 st , 2004 and<br />
December 31 st , 2006. Sixteen of the twenty‐seven crashes reported involved only one vehicle, the<br />
majority of which occurred along the shoulder of the roadway. Approximately half of the reported<br />
crashes occurred when the roadway surface was dry, while the remaining crashes occurred when the<br />
roadway surface conditions were poor (due to snow, ice, mud, or loose gravel). Ten reported crashes<br />
resulted in injuries, none of which resulted in fatalities.<br />
There have been three crashes reported at or near the<br />
intersection of Columbia Falls Stage and River Road. This<br />
intersection creates a sharp curve that requires drivers to slow<br />
down substantially. This curve, coupled with the fact that<br />
there are a high number of speeding drivers along the corridor,<br />
increases the risk of crashes at this location.<br />
The intersections of Columbia Falls Stage with Kelley Road (see<br />
Section 2.7.2 for more detail) and with Hellman Lane are also<br />
potentially dangerous intersections. Three crashes were<br />
Photo 9: Columbia Falls Stage / River Road<br />
reported at or near the intersection with Hellman Lane while<br />
one occurred at the intersection with Kelley Road. Both of these intersections involve 90‐degree<br />
corners which require the driver to either slow substantially or come to a complete stop.<br />
2‐32 | P age Existing <strong>Transportation</strong> System
<strong>Flathead</strong> <strong>County</strong> <strong>Transportation</strong> <strong>Plan</strong> <strong>–</strong> <strong>Phase</strong> <strong>II</strong><br />
Overall there are a large number of crashes occurring along the corridor. It is likely that a majority of<br />
these crashes are the result of users driving too fast for the conditions as is indicated by the scattering of<br />
single vehicle crashes along the corridor. There are also a number of minor approaches that connect to<br />
Columbia Falls Stage which may play a part in the number of crashes.<br />
It is expected that the land use along this corridor will see substantial future commercial and residential<br />
development. As development pressures are realized along this corridor, new right‐of‐way should be<br />
set aside as part of project approval for a future wider roadway section. It will be highly desirable to<br />
provide shoulders along this route in the future as traffic volumes increase.<br />
As developments are planned, traffic impact studies should be required that evaluate what mitigation<br />
may be needed, both on‐site and off‐site, to alleviate potential impacts. Along Columbia Falls Stage, the<br />
planning for left‐turn bays, and potentially right‐turn bays, are likely mitigation techniques that may be<br />
warranted as land use changes. In addition to roadway improvements, the intersection of Columbia<br />
Falls Stage and MT Highway 35 should continually be evaluated for traffic signal control warrants as land<br />
use changes. It is likely that this route will transform from one that serves primarily local traffic, to one<br />
that may start to serve regional through traffic as an alternate to US Highway 206.<br />
Identified Issues<br />
No shoulders<br />
Steep side slopes<br />
Excessive speeding<br />
Substandard vertical curves / limited sight distances<br />
High density of access roads<br />
High number of crashes around the intersection of Columbia Falls Stage and River Road<br />
Sharp curve at the intersection with Hellman Lane; inadequate advance warning signage<br />
Possible need to signalize the intersection with MT Highway 35<br />
Alignment of Kelley Road and Columbia Falls Stage (see Section 2.7.2)<br />
Future development may dramatically increase ADT volumes<br />
4. East Reserve Drive<br />
East Reserve Drive was evaluated from the intersection with<br />
Helena Flats Road west to the intersection with US Highway 2.<br />
East Reserve Drive is a two‐lane paved roadway classified as a<br />
minor arterial. There is a posted speed limit of 45 mph and<br />
little to no shoulder is provided along the corridor.<br />
This corridor is approximately one mile long and serves<br />
multiple residential neighborhoods and businesses in the area.<br />
There are also three schools within a one‐mile radius of East<br />
Reserve Drive. There are currently no sidewalks or bike lanes Photo 10: East Reserve / Helena Flats<br />
provided along the study corridor. Potentially hazardous conditions for pedestrians exist due to the high<br />
speeds along the corridor and the lack of pedestrian and bicycle facilities.<br />
Existing <strong>Transportation</strong> System Page | 2‐33
<strong>Flathead</strong> <strong>County</strong> <strong>Transportation</strong> <strong>Plan</strong> <strong>–</strong> <strong>Phase</strong> <strong>II</strong><br />
Table 2.14 below shows various ADT counts conducted along the study corridor by MDT and <strong>Flathead</strong><br />
<strong>County</strong>. These ADT counts show that current traffic volumes are under theoretical capacity levels for a<br />
paved two‐lane facility.<br />
Table 2.14: East Reserve Drive ADT<br />
Source Location Date ADT<br />
<strong>County</strong> East of US Highway 2 Apr‐99 3,523<br />
<strong>County</strong> West of Helena Flats Road Sep‐05 3,439<br />
MDT East of US Highway 2 2005 4,680<br />
MDT West of Helena Flats Road 2005 2,950<br />
There have been seventeen crashes reported along the study corridor between January 1 st , 2004 and<br />
December 31 st , 2006. Of these crashes, fourteen involved multiple vehicles. Twelve crashes occurred<br />
while pavement conditions were dry. A total of six crashes resulted in injuries, none resulted in<br />
fatalities. The most common type of collision was right angle collisions typically occurring at or near<br />
access points along the corridor.<br />
There were six reported crashes between Ash Road and US Highway 2, three of which occurred at the<br />
Town Pump gas station entrance. It is likely that this concentration of crashes is due to the multiple<br />
driveways associated with the commercial development along this stretch and the close proximity to the<br />
high volume intersection with US Highway 2. The ten crashes that occurred at the signalized<br />
intersection with US Highway 2 involved vehicles either traveling along East Reserve Drive, or turning<br />
from US Highway 2 onto East Reserve Drive. In general, it is likely that the majority of crashes along East<br />
Reserve Drive are a combination of the high number of access points and the high speeds present along<br />
the corridor.<br />
East Reserve Drive is increasingly seeing use as an informal “bypass” for vehicles traveling between US<br />
Highway 2 and MT Highway 35. Because of the usage of this route as a “bypass”, speeds tend to be<br />
faster than expected for this type of facility. As development occurs in the area, and as traffic volumes<br />
increase along US Highway 2, it is likely that this corridor will see an increase in “bypass” usage.<br />
Identified Issues<br />
Limited or no shoulder<br />
High density of access points<br />
Concentration of crashes between US Highway 2 and Ash Road<br />
High speeds near residential neighborhoods and schools<br />
Increasing use as a “bypass” to connect US Highway 2 and MT Highway 35<br />
Limited bicycle/pedestrian facilities<br />
High number of crashes at the intersection with US Highway 2<br />
2‐34 | P age Existing <strong>Transportation</strong> System
5. Foothills Road<br />
<strong>Flathead</strong> <strong>County</strong> <strong>Transportation</strong> <strong>Plan</strong> <strong>–</strong> <strong>Phase</strong> <strong>II</strong><br />
Foothills Road was evaluated from Lake Blaine Road south to Echo Lake Road. Foothills Road is a two‐<br />
lane paved roadway with little or no shoulder. This roadway is used to access recreation and residential<br />
areas along the corridor. Foothills Road has several sharp curves and is very rural in nature. The study<br />
corridor has a posted speed limit of 35 mph and is classified as a major collector.<br />
Table 2.15 below shows various ADT counts completed by <strong>Flathead</strong> <strong>County</strong>. These ADT counts show<br />
that current traffic volumes are well under theoretical capacity levels for a two‐lane paved roadway.<br />
Table 2.15: Foothills Road ADT<br />
Source Location Date ADT<br />
<strong>County</strong> East of Echo Lake Road Nov‐07 737<br />
<strong>County</strong> North of Jewel Basin Road Nov‐07 433<br />
<strong>County</strong> West of Krause Lane Nov‐07 660<br />
<strong>County</strong> South of Bachelor Grade Nov‐07 868<br />
<strong>County</strong> East of Lake Blaine Road Nov‐07 1,170<br />
There were seventeen reported crashes along the ten‐mile stretch of Foothills Road from January 1 st ,<br />
2004 to December 31 st , 2006. Fourteen (or 82%) of the reported crashes involved only one vehicle, the<br />
majority of which occurred along the shoulder of the roadway. Nine of the reported crashes occurred<br />
when road surface conditions were wet, icy, or covered in snow or slush. Five crashes resulted in<br />
injuries, none of which resulted in fatalities. An analysis of the crash info shows a cluster of crashes<br />
reported at or near the following three locations:<br />
Intersection with Jewel Basin Road <strong>–</strong> There were three<br />
reported crashes at this location. Jewel Basin Road<br />
intersects Foothills Road along a curve. There are sight<br />
distance issues, particularly southbound, at this<br />
intersection. The approach angle of Jewel Basin Road<br />
also adds to the dangerous conditions present at this<br />
location.<br />
North of Snowberry Trail <strong>–</strong> There were seven reported<br />
crashes along the one‐mile stretch of Foothills Road<br />
north of Snowberry Trail. The majority of these<br />
crashes occurred just south of the last sharp curve<br />
along Foothills Road that heads to Lake Blaine Road.<br />
This stretch of Foothills Road generally has poor sight<br />
distances in addition to multiple sharp curves that lack<br />
appropriate signing.<br />
Photo 11: Foothills Road / Jewel Basin Road<br />
Photo 12: Snowberry Trail / Foothills Road<br />
Existing <strong>Transportation</strong> System Page | 2‐35
<strong>Flathead</strong> <strong>County</strong> <strong>Transportation</strong> <strong>Plan</strong> <strong>–</strong> <strong>Phase</strong> <strong>II</strong><br />
Peters Creek Way to Bachelor Grade Road <strong>–</strong> There<br />
were four reported crashes along this one‐mile stretch<br />
of Foothills Road. This stretch has multiple sharp<br />
curves with limited sight distance in addition to<br />
multiple approaches connecting to the corridor.<br />
Currently, a yield sign is provided along Bachelor Grade<br />
Road at the intersection with Foothills Road. The yield<br />
sign, coupled with the approach angle of Bachelor<br />
Grade Road, gives a false sense of priority to drivers<br />
accessing Foothills Road at this location.<br />
In general, Foothills Road is windy, has locations of limited sight distance, and has little to no shoulder.<br />
These factors contribute to a potentially dangerous roadway. As traffic volumes increase along Foothills<br />
Road, issues regarding the safety of the corridor may worsen as the effects of the roadway<br />
characteristics become more influential on the corridor traffic.<br />
Identified Issues:<br />
Multiple sharp horizontal curves and substandard vertical curves that limit sight distance and<br />
create safety issues<br />
Intersections along curves<br />
Inadequate signing in some locations<br />
Increasing ADT may decrease roadway safety<br />
6. Helena Flats Road<br />
Photo 13: Bachelor Grade Road / Foothills Road<br />
Helena Flats Road was evaluated from MT Highway 35 north to<br />
East Reserve Drive. Helena Flats Road is a two‐lane paved<br />
roadway with little to no shoulder and is classified as a minor<br />
arterial. This corridor serves local residents and connects<br />
Highway 35 to Highway 2 via East Reserve Drive. The study<br />
corridor has a posted speed limit of 35 mph.<br />
This corridor is increasingly seeing use as an informal “bypass”<br />
for vehicles traveling between US Highway 2 and MT Highway<br />
Photo 14: Helena Flats Road 35. This usage is being fueled by those travelers wishing to<br />
avoid the intersection and additional trip length by going<br />
through the intersection of LaSalle Road and MT Highway 35.<br />
Helena Flats Road is a major corridor used to access the Evergreen Schools (both junior high and<br />
elementary). This corridor currently lacks sidewalks and bike lanes. The close proximity to schools in<br />
the area increases the likelihood of students being present along the corridor, either walking or biking.<br />
Potentially hazardous conditions for pedestrians exist due to the speeds along the corridor and the lack<br />
of pedestrian and bicycle facilities.<br />
A speed study was conducted by RPA along Helena Flats Road in August 2008 north of US Highway 2.<br />
The speed study showed an average speed of 34.5 mph and an 85 th percentile speed of 39.2 mph. The<br />
2‐36 | P age Existing <strong>Transportation</strong> System
<strong>Flathead</strong> <strong>County</strong> <strong>Transportation</strong> <strong>Plan</strong> <strong>–</strong> <strong>Phase</strong> <strong>II</strong><br />
speed study indicates that the average speed is lower than the posted speed limit of 35 mph, while the<br />
85 th percentile speed is within 5 mph of the posted speed limit. These results do not indicate that there<br />
is currently a speeding problem along Helena Flats Road at the location observed. The number of access<br />
points and the narrow roadway width are likely factors at maintaining relatively low speeds along this<br />
corridor.<br />
Table 2.16 below shows various ADT counts conducted along the study corridor by MDT, RPA and<br />
<strong>Flathead</strong> <strong>County</strong>. These ADT counts show that current traffic volumes are under theoretical capacity<br />
levels for a paved two‐lane facility.<br />
Table 2.16: Helena Flats Road ADT<br />
Source Location Date ADT<br />
<strong>County</strong> North of East Evergreen Drive Sep‐05 3,671<br />
<strong>County</strong> South of East Evergreen Drive Oct‐07 3,864<br />
MDT South of East Reserve Drive 2005 2,920<br />
MDT North of MT Highway 35 2005 3,410<br />
RPA 1 North of East Evergreen Drive Aug‐08 3,962<br />
1 Represents single day ADT count; value was not adjusted for seasonal or daily variation.<br />
There have been sixteen crashes reported along the study corridor between January 1 st , 2004 and<br />
December 31 st , 2006. Of these crashes, fourteen involved multiple vehicles. Seven crashes occurred<br />
while pavement conditions were dry while the remaining nine occurred while the pavement was wet or<br />
icy. A total of six crashes resulted in injuries, none of which resulted in fatalities. The most common<br />
type of collision was right angle collisions typically occurring at access points along the corridor.<br />
There were two reported crashes at the intersection with East<br />
Reserve Drive (see Section 2.7.2 for more detail). Eight crashes<br />
occurred at the unsignalized intersection with MT Highway 35.<br />
This intersection is very wide and ill‐defined. Also, southbound<br />
to eastbound drivers have a difficult time entering the traffic<br />
stream. This movement volume is increasing due to drivers<br />
avoiding LaSalle Road. Potential traffic signal control may be<br />
warranted as land use changes are proposed east of the<br />
<strong>Flathead</strong> River.<br />
Identified Issues:<br />
Increasing traffic volumes<br />
Narrow roadway with no shoulders<br />
Lack of bicycle and pedestrian facilities<br />
Potential traffic signal needed at the intersection with MT Highway 35<br />
Schools in the area increase the potential risk along the corridor<br />
Photo 15: Helena Flats Road / MT Highway 35<br />
Existing <strong>Transportation</strong> System Page | 2‐37
<strong>Flathead</strong> <strong>County</strong> <strong>Transportation</strong> <strong>Plan</strong> <strong>–</strong> <strong>Phase</strong> <strong>II</strong><br />
7. Hodgson Road<br />
Hodgson Road was evaluated from US Highway 93 to US<br />
Highway 2. Hodgson Road is a two‐lane paved roadway with<br />
little to no shoulder and is classified as a major collector. The<br />
corridor serves local traffic and also serves as a connecting<br />
route between US Highway 93 and US Highway 2. The speed<br />
limit along Hodgson Road is 40 mph.<br />
Hodgson Road between US Highway 2 and Whitefish Stage is<br />
generally flat with some locations of steep side slopes. This<br />
portion of the study corridor is fairly undeveloped. Hodgson<br />
Photo 16: Hodgson Road / Whitefish Stage<br />
Road between Whitefish Stage and US Highway 93 is generally<br />
curvy and has areas with substandard vertical curves. A number of residential developments exist in this<br />
area and utilize Hodgson Road.<br />
The adjacent land use along this corridor is ripe for future development. As development pressures are<br />
realized along this corridor, new right‐of‐way should be set aside as part of project approval for a future<br />
wider roadway section. It will be highly desirable to provide shoulders along this route in the future.<br />
Access control along this roadway should also be considered as development occurs in the area.<br />
As developments are planned, traffic impact studies (TIS’s) should be required that evaluate what<br />
mitigation may be needed, both on‐site and off‐site, to alleviate potential impacts. Along Hodgson<br />
Road, the planning for left‐turn bays, and potentially right‐turn bays, are likely mitigation techniques<br />
that may be warranted as land use changes.<br />
Table 2.17 below shows various ADT counts conducted along the study corridor by <strong>Flathead</strong> <strong>County</strong>.<br />
These ADT counts show that current traffic volumes are under theoretical capacity levels for a paved<br />
two‐lane facility.<br />
Table 2.17: Hodgson Road ADT<br />
Source Location Date ADT<br />
<strong>County</strong> East of Trumble Creek Road Sep‐07 1,222<br />
<strong>County</strong> East of Whitefish Stage Sep‐07 1,350<br />
<strong>County</strong> East of US Highway 93 Oct‐07 1,850<br />
<strong>County</strong> West of US Highway 2 Sep‐07 1,355<br />
<strong>County</strong> West of Whitefish Stage Oct‐07 1,388<br />
There have been twenty‐five reported crashes along the study corridor between January 1 st , 2004 and<br />
December 31 st , 2006. Of these crashes, fourteen involved multiple vehicles. Thirteen crashes occurred<br />
while pavement conditions were dry while the remaining eleven occurred while the pavement was wet,<br />
snowy, slushy, or icy. Seven crashes resulted in injuries, one of which resulted in a fatality. The most<br />
common type of collision was right angle collisions typically occurring at access points or intersections<br />
along the corridor.<br />
2‐38 | P age Existing <strong>Transportation</strong> System
<strong>Flathead</strong> <strong>County</strong> <strong>Transportation</strong> <strong>Plan</strong> <strong>–</strong> <strong>Phase</strong> <strong>II</strong><br />
An analysis of the crash data shows a cluster of crashes along Hodgson Road at four locations: 1)<br />
intersection with US Highway 93; 2) between Hare Trail and Lidstrom Road; 3) intersection with<br />
Whitefish Stage (see Section 2.7.2 for more detail); and 4) intersection with US Highway 2.<br />
Hare Trail to Lidstrom Road <strong>–</strong> There were ten reported<br />
crashes along this ¾ mile section of Hodgson Road.<br />
This section of Hodgson Road is narrow and windy and<br />
has multiple residential access points and connecting<br />
roads, many of which have poor sight distance. The<br />
majority of these crashes occurred at intersections or<br />
along corners or hills where sight distance is limited.<br />
Seven crashes occurred when the roadway was icy or<br />
snowy. Three crashes resulted in injuries along this<br />
section of Hodgson Road.<br />
Intersection with US Highway 93 <strong>–</strong> There were three<br />
reported crashes at this location, none of which<br />
resulted in injuries. This is a three‐legged intersection<br />
with stop control along Hodgson Road. US Highway 93<br />
has two travel lanes in each direction along with a<br />
center raised median. This intersection has some sight<br />
distance issues, particularly along the Hodgson Road<br />
leg. While traveling west along Hodgson Road, it is<br />
difficult to see this intersection due to the vertical<br />
curve present near the intersection. There is also no<br />
advanced warning sign for this intersection along<br />
Hodgson Road.<br />
Intersection with US Highway 2 <strong>–</strong> There were five<br />
crashes reported at this intersection. Of these crashes,<br />
all but one involved multiple vehicles. Three crashes<br />
resulted in injuries, one of which resulted in a fatality.<br />
US Highway 2 is a five‐lane roadway consisting of two<br />
travel lanes in each direction and a two‐way left‐turn<br />
lane. This intersection does not appear to have sight<br />
distance or geometric configuration issues. It is<br />
expected that the high number of crashes occurring at<br />
this location are largely due to the high volume and<br />
large size nature of the intersection.<br />
Photo 17: Limited sight distances along Hodgson Road<br />
Photo 18: Hodgson Road / US Highway 93<br />
Photo 19: Hodgson Road / US Highway 2<br />
Hodgson Road between US Highway 93 and Whitefish Stage has experienced a high number of crashes.<br />
This portion of Hodgson Road is windy, has locations of limited sight distances, has little to no shoulder,<br />
and has multiple access roads and residential roads connecting to it. As development occurs along<br />
Hodgson Road and as ADTs continue to rise, the number of crashes will only increase. The current<br />
speed limit of 40 mph along Hodgson Road may need to be reanalyzed to determine if changes need to<br />
be made to help decrease the rate of crashes long this corridor.<br />
Existing <strong>Transportation</strong> System Page | 2‐39
<strong>Flathead</strong> <strong>County</strong> <strong>Transportation</strong> <strong>Plan</strong> <strong>–</strong> <strong>Phase</strong> <strong>II</strong><br />
Identified Issues:<br />
Increasing traffic volumes<br />
Narrow windy roadway with no shoulders<br />
Limited sight distances<br />
High rate of crashes, particularly between Whitefish Stage and US Highway 93<br />
8. Holt Stage Road / Mennonite Church Road<br />
Photo 20: Holt Stage Road<br />
Holt Stage Road / Mennonite Church Road was evaluated from<br />
Steel Bridge Road to Creston Hatchery Road. This corridor is a<br />
two‐lane roadway that is paved along Holt Stage Road and<br />
gravel along Mennonite Church Road. This corridor serves<br />
local residents and connects the City of Kalispell to MT<br />
Highway 35. There is generally no shoulder provided and there<br />
are areas with steep side slopes. This corridor is classified as a<br />
major collector roadway with a speed limit of 35 mph. The<br />
area that the corridor serves is fairly undeveloped and consists<br />
mostly of fields and farmland.<br />
The Old Steel Bridge is currently being replaced, and as a result, current traffic volumes may not be<br />
representative of typical use. Once the new bridge is in place, travel patterns are likely to change in this<br />
area. The lands adjacent to Holt Stage Road will be ripe for development, and as time goes on<br />
development pressures will certainly increase.<br />
Table 2.18 below shows various ADT counts conducted along the study corridor by <strong>Flathead</strong> <strong>County</strong>.<br />
These ADT counts show that current traffic volumes along Holt Stage Road are under theoretical<br />
capacity levels for a paved two‐lane facility, while current ADT values along Mennonite Church Road are<br />
approaching or exceeding the suggested roadway paving trigger value of 400 vpd.<br />
Table 2.18: Holt Stage Road / Mennonite Church Road ADT<br />
Source Location Date ADT<br />
<strong>County</strong> East of Steel Bridge Road Sep‐04 607<br />
<strong>County</strong> East of Montford Road Aug‐04 248<br />
<strong>County</strong> West of MT Highway 35 Sep‐06 190<br />
<strong>County</strong> East of MT Highway 35 Nov‐07 416<br />
<strong>County</strong> West of Creston Hatchery Road Nov‐07 339<br />
There have been six reported crashes along the study corridor between January 1 st , 2004 and December<br />
31 st , 2006. Five out of the six crashes reported involved only one vehicle, all of which occurred at night.<br />
Two crashes resulted in injuries, none of which resulted in fatalities.<br />
In general, the study corridor has seen very few crashes over the three year study period. An analysis of<br />
the crash data shows that most of the crashes are likely due to users driving too fast for the conditions,<br />
especially at night. There appears to be no pattern of where the crashes are taking place. As a result,<br />
2‐40 | P age Existing <strong>Transportation</strong> System
<strong>Flathead</strong> <strong>County</strong> <strong>Transportation</strong> <strong>Plan</strong> <strong>–</strong> <strong>Phase</strong> <strong>II</strong><br />
there are no identified deficient areas that are directly resulting in unsafe conditions along the study<br />
corridor.<br />
Identified Issues:<br />
Potentially increasing traffic volumes<br />
Bridge reconstruction may change roadway usage<br />
Steep sides lack guardrail along the western portion of Holt Stage Road<br />
Traffic volumes approaching or exceeding the paving trigger along Mennonite Church Road<br />
9. Kila Road<br />
Kila Road was evaluated from the north intersection with US<br />
Highway 2 to the south intersection with US Highway 2. Kila<br />
Road has little to no shoulder and has multiple sharp curves,<br />
especially along the southern portion of the corridor. This is a<br />
two‐lane paved roadway that serves the residents of Kila and<br />
surrounding areas. The roadway is classified as a major<br />
collector and has a speed limit of 35 mph.<br />
Kila Road west of Smith Lake Road is windy, steep, has steep<br />
slopes, and has areas with very limited sight distances. Both<br />
Photo 21: Kila Road<br />
the northern and southern intersections of Kila Road and US<br />
Highway 2 are skewed and provide limited sight distances (see Section 2.3.2 for more detail).<br />
Table 2.19 below shows various ADT counts conducted along the study corridor by <strong>Flathead</strong> <strong>County</strong>.<br />
These ADT counts show that current traffic volumes are under theoretical capacity levels for a paved<br />
two‐lane facility. As is indicated by these traffic volumes, the majority of traffic along Kila Road utilizes<br />
the northern most intersection with US Highway 2.<br />
Table 2.19: Kila Road ADT<br />
Source Location Date ADT<br />
<strong>County</strong> At north intersection with US Highway 2 Sep‐05 1,960<br />
<strong>County</strong> East of Smith Lake Road Sep‐05 1,665<br />
<strong>County</strong> West of Smith Lake Road Aug‐03 166<br />
<strong>County</strong> At south intersection with US Highway 2 Aug‐03 151<br />
There have been eleven reported crashes along Kila Road between January 1 st , 2004 and December 31 st ,<br />
2006. Nine of the eleven reported crashes involved a single vehicle, most of which occurred along the<br />
shoulder of the roadway. Four crashes resulted in injuries, none of which resulted in a fatality. Four<br />
crashes occurred while the road was snowy or icy, while the other seven occurred when the road<br />
surface was dry. Five of the reported crashes occurred at the northern intersection of Kila Road and US<br />
Highway 2 (see Section 2.7.2 for more detail). The remaining six reported crashes occurred sporadically<br />
along Kila Road.<br />
Existing <strong>Transportation</strong> System Page | 2‐41
<strong>Flathead</strong> <strong>County</strong> <strong>Transportation</strong> <strong>Plan</strong> <strong>–</strong> <strong>Phase</strong> <strong>II</strong><br />
Kila Road generally has seen very few crashes over the three year study period other than those<br />
occurring at the intersection with US Highway 2. An analysis of the crash data shows that most of the<br />
crashes involved only one vehicle and are likely due to users driving too fast for the conditions, and as a<br />
result, running off the road.<br />
Identified Issues:<br />
Skewed intersections with US Highway 2 with limited sight distance<br />
Sharp curves, steep slopes, and limited sight distance west of Smith Lake Road<br />
No advanced warning signs for intersections<br />
Substandard vertical and horizontal geometrics at southern intersection with US Highway 2<br />
10. Lake Blaine Road<br />
Photo 22: Lake Blaine Road / Foothills Road<br />
Lake Blaine Road was evaluated from MT Highway 35 to the<br />
intersection with Hemler Creek Drive. Lake Blaine Road has<br />
little to no shoulder and has some sharp curves along its<br />
northern end which cause limited sight distance. This is a<br />
paved two‐lane roadway that serves local residents and allows<br />
access to Lake Blaine. The speed limit along Lake Blain Road is<br />
45 mph from MT Highway 35 to Foothills Road, and 25 mph<br />
from Foothills Road to its end. Lake Blaine Road is classified as<br />
a major collector between MT Highway 35 and Foothills Road<br />
and as a minor collector from Foothills Road to its end.<br />
Cayuse Prairie School is located off Lake Blaine Road. Currently there is no designated “school zone”<br />
located along the roadway in the vicinity of the school. A lack of signing and pedestrian / bicycle<br />
facilities exist near the school and along Lake Blaine Road.<br />
The intersection of Lake Blaine Road and Foothills Road currently has limited sight distance. A yield sign<br />
exists along the northern leg of this intersection. This yield sign, coupled with the limited sight distance<br />
and skewed southbound approach angle creates a dangerous intersection, especially as traffic volumes<br />
continue to increase in the area. Vehicles currently traveling south along Lake Blaine Road wishing to<br />
take a right at the intersection may feel a false sense of priority to westbound vehicles based on the<br />
current intersection conditions.<br />
A speed study was conducted by RPA along Lake Blaine Road in August 2008, west of Van Sant Road.<br />
The speed study showed an average speed of 47.5 mph and an 85 th percentile speed of 53.4 mph. The<br />
study results showed that the average speed is slightly higher than the posted speed limit of 45 mph,<br />
while the 85 th percentile speed is more than 8 mph higher than the posted speed limit. These results<br />
indicate that there is a potential speeding problem along Lake Blaine Road.<br />
Table 2.20 on the following page shows various ADT counts conducted along the study corridor by<br />
<strong>Flathead</strong> <strong>County</strong>, MDT, and RPA. These ADT counts show that current traffic volumes are under<br />
theoretical capacity levels for a paved two‐lane facility.<br />
2‐42 | P age Existing <strong>Transportation</strong> System
Table 2.20: Lake Blaine Road ADT<br />
<strong>Flathead</strong> <strong>County</strong> <strong>Transportation</strong> <strong>Plan</strong> <strong>–</strong> <strong>Phase</strong> <strong>II</strong><br />
Source Location Date ADT<br />
<strong>County</strong> East of MT Highway 35 Nov‐07 3165<br />
<strong>County</strong> North of Foothills Road Nov‐07 381<br />
MDT East of MT Highway 35 2005 2600<br />
RPA 1 West of Van Sant Road Aug‐08 1713<br />
1 Represents single day ADT count; value was not adjusted for seasonal or daily variation.<br />
There were seventeen reported crashes along Lake Blaine Road between January 1 st , 2004 and<br />
December 31 st , 2006. Of these crashes, eleven involved only one vehicle, most of which occurred along<br />
the shoulder of the roadway. Six crashes occurred while the road surface was dry, while the remaining<br />
eleven occurred while the road was wet, snowy, slushy, or icy. Of the seventeen reported crashes, eight<br />
resulted in injuries, none of which resulted in fatalities.<br />
An analysis of the crash data shows that the majority of the crashes were spread out along Lake Blaine<br />
Drive. No apparent cluster of crashes has been identified. In general, the majority of the crashes appear<br />
to be the result of users driving too fast for the conditions and, as a result, running off the roadway. This<br />
is supported by the speed study that was conducted that indicates a potential problem with speeding<br />
vehicles along the study corridor.<br />
Identified Issues:<br />
Potential speeding problem<br />
Lack of shoulders and steep side slopes<br />
Vertical curves limit sight distance<br />
Multiple access points<br />
No “School Zone” near Cayuse Prairie School<br />
Lack of pedestrian and bicycle facilities<br />
Sight distance and signing issues at the intersection with Foothills Road<br />
High number of single vehicle crashes<br />
11. Lower Valley Road<br />
Lower Valley Road was evaluated from the intersection with<br />
Willow Glen Drive to the intersection with MT Highway 82.<br />
Lower Valley Road is a paved two‐lane roadway with little to<br />
no shoulder and is classified as a minor collector. This corridor<br />
was not evaluated as part of the <strong>Phase</strong> 1 plan.<br />
This corridor is flat but has multiple sharp horizontal curves,<br />
many of which are 90‐degree corners. A speed limit of 45 mph<br />
exists along Lower Valley Road; however, some of the sharp<br />
Photo 23: Lower Valley Road<br />
corners are signed for slower speeds. Farmland generally<br />
surrounds the corridor, with some light residential mixed in, mostly along the northern portion.<br />
Existing <strong>Transportation</strong> System Page | 2‐43
<strong>Flathead</strong> <strong>County</strong> <strong>Transportation</strong> <strong>Plan</strong> <strong>–</strong> <strong>Phase</strong> <strong>II</strong><br />
A speed study was conducted by RPA along Lower Valley Road east of Foys Bend Lane in August 2008.<br />
The speed study showed an average speed of 46.5 mph and an 85 th percentile speed of 55.7 mph. The<br />
speed study indicates that the average speed is slightly higher than the posted speed limit of 45 mph,<br />
while the 85 th percentile speed is more than 10 mph higher than the posted speed limit. The results of<br />
the speed study indicate that there is a potential speeding problem along Lower Valley Road.<br />
Table 2.21 below shows various ADT counts conducted along the study corridor by <strong>Flathead</strong> <strong>County</strong> and<br />
RPA. These ADT counts show that current traffic volumes are under theoretical capacity levels for a<br />
paved two‐lane facility.<br />
Table 2.21: Lower Valley Road ADT<br />
Source Location Date ADT<br />
<strong>County</strong> East of Willow Glen Drive Sep‐05 2143<br />
<strong>County</strong> North of Manning Road Aug‐07 178<br />
<strong>County</strong> North of MT Highway 82 Jun‐05 314<br />
RPA 1 East of Foys Bend Lane Aug‐08 1094<br />
1 Represents single day ADT count; value was not adjusted for seasonal or daily variation.<br />
There were eighteen reported crashes along Lower Valley Road between January 1 st , 2004 and<br />
December 31 st , 2006. Fifteen of these reported crashes involved only one vehicle, the majority of which<br />
occurred along the shoulder of the roadway. Thirteen of the eighteen reported crashes occurred while<br />
the road surface was dry. Eight crashes resulted in injuries, none of which resulted in fatalities.<br />
An analysis of the crash data shows that nine of the reported crashes (or 50%) occurred at or near the<br />
intersection with Foys Bend Lane. This intersection is a 90‐degree corner with little signing. The<br />
majority of the remaining nine reported crashes occurred near other sharp corners present along Lower<br />
Valley Road, although no other clusters of crashes were observed.<br />
In general, the majority of the crashes along Lower Valley Road appear to be the result of users driving<br />
too fast around a sharp corner, and as a result, running off the road. This is supported by the speed<br />
study that was conducted that points to a potential problem with speeding vehicles along the study<br />
corridor.<br />
Identified Issues:<br />
Potential speeding problem<br />
Lack of shoulders<br />
Multiple sharp corners<br />
Inadequate signing at some locations<br />
Large number of crashes at or near the intersection with Foys Bend Lane<br />
Crashes along 90‐degree corners<br />
2‐44 | P age Existing <strong>Transportation</strong> System
12. Spring Hill Road<br />
Spring Hill Road was evaluated from the intersection with Smith<br />
Lake Road to its end. Spring Hill Road is a two‐lane gravel<br />
roadway with little to no shoulder. The road has several sharp<br />
curves and a portion of the roadway is on a steep vertical grade.<br />
This roadway serves residents along the corridor and also<br />
provides access to recreational areas in the area. The speed<br />
limit along Spring Hill Road is 35 mph and it is classified as a<br />
minor collector.<br />
<strong>Flathead</strong> <strong>County</strong> <strong>Transportation</strong> <strong>Plan</strong> <strong>–</strong> <strong>Phase</strong> <strong>II</strong><br />
Table 2.22 below shows various ADT counts conducted along<br />
Photo 24: Spring Hill Road<br />
the study corridor by <strong>Flathead</strong> <strong>County</strong>. These ADT counts show<br />
that current traffic volumes are well under theoretical capacity levels for a two‐lane roadway. Current<br />
traffic volumes are also under the suggested roadway paving trigger value of 400 vpd.<br />
Table 2.22: Spring Hill Road ADT<br />
Source Location Date ADT<br />
<strong>County</strong> East of Smith Lake Road Aug‐07 286<br />
<strong>County</strong> 1.1 miles east of Smith Lake Road Sep‐00 100<br />
There was only one reported crash along Spring Hill Road between January 1 st , 2004 and December 31 st ,<br />
2006. The crash occurred near the intersection with Smith Lake Road and was the result of a single<br />
vehicle running off of the road due to excessive speed for the conditions.<br />
In general, Spring Hill Road is a steep windy road that is difficult to traverse during times of inclement<br />
weather. Chains or studded tires are recommended during the winter. The crash analysis competed for<br />
the corridor did not identify any specific problematic areas resulting in crashes. If development occurs<br />
in the area, and ADTs increase, this corridor may approach the roadway paving trigger and safety issues<br />
may become a greater concern.<br />
Identified Issues:<br />
Lack of advance warning signs for curves<br />
Future ADTs may reach paving threshold<br />
No shoulders<br />
Sight distance<br />
Difficult to traverse during inclement weather<br />
Steep grades<br />
Existing <strong>Transportation</strong> System Page | 2‐45
<strong>Flathead</strong> <strong>County</strong> <strong>Transportation</strong> <strong>Plan</strong> <strong>–</strong> <strong>Phase</strong> <strong>II</strong><br />
2.7.2 STUDY INTERSECTIONS<br />
This section provides information on the sixteen intersections that were evaluated as part of this<br />
<strong>Transportation</strong> <strong>Plan</strong>. These study intersection were chosen based on their importance to the roadway<br />
network, known traffic patterns, community desire, and identified problem areas. Each of the study<br />
intersections were also analyzed in the previous <strong>Phase</strong> 1 study and include select signalized and<br />
unsignalized intersections. The following are the sixteen study intersections evaluated in detail (also<br />
shown graphically in Figure 2.9):<br />
1. Auction Road and Demersville Road<br />
2. Batavia Lane and US Highway 2<br />
3. Beach Drive and Holt Drive<br />
4. Best Way and Truck Route<br />
5. Columbia Falls Stage and Kelley Road<br />
6. Fairmont Road and MT Highway 35<br />
7. Helena Flats Road and East Evergreen Drive<br />
8. Helena Flats Road and East Reserve Drive<br />
9. Hodgson Road and Whitefish Stage<br />
10. Kila Road and US Highway 2<br />
11. West Springcreek Road and US Highway 2<br />
12. West Valley Drive and Three Mile Drive<br />
13. Whitefish Stage and Granrud Lane<br />
14. Whitefish Stage and Mission Trail<br />
15. Whitefish Stage and West Evergreen Drive<br />
16. Whitefish Stage and Winchester Street<br />
Each study intersection was analyzed in detail using a number of factors. The previous sections of this<br />
Chapter provide information for the intersection performance, preliminary signal warrants and crash<br />
analysis. This section uses this previous information along with site visit data to look at each study<br />
intersection in detail to define the existing conditions and to identify potential problems.<br />
2‐46 | P age Existing <strong>Transportation</strong> System
1. Auction Road and Demersville Road<br />
The intersection of Auction Road and Demersville Road is<br />
located south of Kalispell just off of US Highway 93. Auction<br />
Road is a two‐lane paved roadway that runs parallel to US<br />
Highway 2. Demersville Road is a two‐lane paved roadway that<br />
runs north/south. The intersection of Auction Road and<br />
Demersville Road is a skewed three‐way intersection that has<br />
stop control along the western leg of Auction Road.<br />
No reported crashes occurred at this intersection during the<br />
three‐year crash analysis period. The traffic volumes are<br />
currently low at this intersection, which result in a LOS of A for<br />
both the morning and evening peak hours. This is currently a<br />
very low volume intersection with fairly distributed turning<br />
movements.<br />
The development and construction presently occurring along<br />
Demersville Road will increase the traffic at this location in the<br />
near future. As traffic volumes increase, the skewed and ill‐<br />
defined nature of this intersection could prove to be<br />
problematic. While this intersection currently has low enough<br />
traffic volumes to remain safe and effective, it should be<br />
analyzed in the future as these volumes increase.<br />
Identified Issues:<br />
Skewed and ill‐defined<br />
Increasing ADT may create safety concerns<br />
<strong>Flathead</strong> <strong>County</strong> <strong>Transportation</strong> <strong>Plan</strong> <strong>–</strong> <strong>Phase</strong> <strong>II</strong><br />
Photo 25: Auction Road / Demersville Road<br />
intersection; from top to bottom: Looking north;<br />
looking west; looking south.<br />
Existing <strong>Transportation</strong> System Page | 2‐47
<strong>Flathead</strong> <strong>County</strong> <strong>Transportation</strong> <strong>Plan</strong> <strong>–</strong> <strong>Phase</strong> <strong>II</strong><br />
2. Batavia Lane and US Highway 2<br />
Photo 26: Batavia Lane / US Highway 2 intersection;<br />
from top to bottom: looking west; looking north;<br />
looking south.<br />
Identified Issues:<br />
The intersection of Batavia Lane and US Highway 2 is located<br />
west of Kalispell. Batavia Lane is a paved two‐lane roadway.<br />
US Highway 2 is a two‐lane highway that serves regional and<br />
local traffic. This intersection is a skewed three‐way<br />
intersection that has stop control along Batavia Lane. A<br />
northbound left‐turn lane is provided along US Highway 2 at<br />
this location. A widened paved shoulder is provided along the<br />
southbound lane which serves as a right‐turn lane. No striping<br />
currently exists designating this as a right‐turn lane, however.<br />
A gas station is located at the northwest corner and Smith<br />
Valley School is located along the southwest corner of this<br />
intersection. Painted crosswalks currently exist across the<br />
southern leg of US Highway 2 and across Batavia Lane.<br />
Crossing guards are used to help students cross US Highway 2<br />
at this intersection. The speed limit along US Highway 2 is 45<br />
mph in the adjacent school zone.<br />
Two crashes occurred at this location during the three‐year<br />
study period. Both crashes involved multiple vehicles and each<br />
resulted in non‐incapacitating injuries. The LOS analysis<br />
completed for this intersection indicates a LOS of D for the AM<br />
peak hour and a LOS of C for the PM peak hour. It is expected<br />
that a large portion of the AM peak hour traffic is directly a<br />
result of the school located at this intersection.<br />
The preliminary signal warrant analysis completed in Section<br />
2.5 indicates that a signal is warranted based on four‐hour<br />
traffic volumes and peak hour traffic volumes. It should be<br />
noted that the school crossing signal warrant (number 5) was<br />
not analyzed due to insufficient data. This intersection should<br />
be analyzed in more detail to determine if a traffic signal or<br />
other traffic control device is appropriate for this location.<br />
Batavia Lane skewed approach alignment<br />
School along the southwest corner<br />
Gas station along the northwest corner<br />
Students crossing US Highway 2<br />
Failing LOS during AM peak hour<br />
Preliminary signal warrant analysis indicates a signal may be warranted<br />
Shoulder along southbound lane is not striped for a right‐turn lane<br />
2‐48 | P age Existing <strong>Transportation</strong> System
3. Beach Drive and Holt Drive<br />
The intersection of Beach Drive and Holt Drive is located in<br />
Bigfork, southeast of Kalispell. Holt Drive is a paved two‐lane<br />
major collector roadway which connects to MT Highway 35.<br />
Beach Drive makes up the southern leg of the intersection and<br />
is a local road which provides access to local residents and to<br />
<strong>Flathead</strong> Lake. Ichabod Lane makes up the northern approach<br />
leg of the intersection and is a local residential access road.<br />
This intersection is a four‐legged intersection with stop control<br />
provided along Beach Drive and Ichabod Lane. The approach<br />
along Beach Drive is very skewed and steep. A separate right‐<br />
turn lane is provided along the southern leg of the intersection.<br />
A stop sign and curbing divides the right‐turn lane and<br />
thru/left‐turn lane along this leg. The sight distance along the<br />
southern leg is limited due to the approach angle and<br />
steepness of the roadway.<br />
No reported crashes occurred at this intersection during the<br />
three‐year analysis period. The LOS analysis shows a LOS of B<br />
during the AM and PM peak hours. While there were no<br />
reported crashes during the study period and the LOS indicates<br />
that the intersection is performing adequately, this is likely the<br />
result of the low traffic volumes at this intersection. Overall<br />
this is a very awkward intersection that has multiple geometric<br />
issues.<br />
Identified Issues:<br />
Holt Drive is skewed and steep<br />
Separate right‐turn lane divided by stop sign and<br />
curbing<br />
Limited sight distance<br />
Northern and southern approach alignment is poor<br />
<strong>Flathead</strong> <strong>County</strong> <strong>Transportation</strong> <strong>Plan</strong> <strong>–</strong> <strong>Phase</strong> <strong>II</strong><br />
Photo 27: Beach Drive / Holt Drive intersection; from<br />
top to bottom: looking west; looking south; looking<br />
east; looking north.<br />
Existing <strong>Transportation</strong> System Page | 2‐49
<strong>Flathead</strong> <strong>County</strong> <strong>Transportation</strong> <strong>Plan</strong> <strong>–</strong> <strong>Phase</strong> <strong>II</strong><br />
4. Best Way and Truck Route<br />
Photo 28: Best Way / Truck Route Intersection; from<br />
top to bottom: looking west; looking east; looking<br />
north; looking south.<br />
The intersection of Best Way and Truck Route is located along<br />
the western portion of Columbia Falls. Best Way and Truck<br />
Route are both two‐lane paved roadways that mostly serve<br />
industrial and commercial businesses in the area. This<br />
intersection is a four‐way stop‐controlled intersection. A<br />
substantial number of large trucks utilize this intersection due<br />
to its close proximity to a logging mill and other businesses in<br />
the area.<br />
No reported crashes occurred at this intersection during the<br />
three‐year crash analysis period. The traffic volumes are<br />
currently low at this intersection, which result in a LOS of A for<br />
both the AM and PM peak hours.<br />
This intersection presently functions at an acceptable LOS and<br />
does not appear to have safety issues resulting in high crash<br />
rates. An analysis of the current traffic volumes utilizing this<br />
intersection indicate that the volumes are fairly distributed<br />
along all four legs of the intersection. As traffic volumes<br />
increase, this intersection should be analyzed in more detail to<br />
determine if the stop control currently being provided along all<br />
four legs is still necessary, or if other traffic control measures<br />
are needed. It should be noted that the four‐way stop‐<br />
controlled intersection is the most restrictive form of<br />
intersection traffic control and often results in increased delay<br />
and vehicle emissions.<br />
It is uncertain if all four corners of the intersection currently<br />
accommodate large trucks. Due to the high percentage of<br />
large trucks utilizing this intersection, it is important that the<br />
corner radii accommodate a large enough design vehicle.<br />
Identified Issues:<br />
High volume of large truck traffic<br />
Four‐way stop control<br />
Small corner radii<br />
2‐50 | P age Existing <strong>Transportation</strong> System
5. Columbia Falls Stage and Kelley Road<br />
The intersection of Columbia Falls Stage and Kelley Road is<br />
located south of Columbia Falls. Columbia Falls Stage is a two‐<br />
lane paved roadway classified as a major collector. This<br />
corridor serves as an alternate route to MT Highway 206 and<br />
connects Kalispell to Columbia Falls east of the <strong>Flathead</strong> River.<br />
Kelley Road is a two‐lane paved roadway classified as a minor<br />
collector. Kelley Road connects Columbia Falls Stage to MT<br />
Highway 206 south of Columbia Falls. The intersection of<br />
Columbia Falls Stage and Kelley Road is a three‐legged<br />
intersection with stop control along the northern leg of<br />
Columbia Falls Stage.<br />
The crash analysis completed for this intersection shows that<br />
one crash occurred during the three‐year study period. The<br />
crash involved two vehicles but did not result in any reported<br />
injuries. The LOS analysis completed shows that this<br />
intersection performs at a LOS of A during both the AM and<br />
PM peak hours.<br />
An analysis of the traffic distribution at this intersection<br />
indicates that the majority of the traffic occurs along Columbia<br />
Falls Stage which acts as the mainline corridor. A large portion<br />
of the traffic at this intersection travels along the western and<br />
southern approach of Columbia Falls Stage. Most of the traffic<br />
along the eastern leg of Kelley Road takes a right at the<br />
intersection to head north along Columbia Falls Stage.<br />
As development occurs in the area, and as traffic volumes<br />
increase, it is expected that this intersection will become more<br />
problematic due to the current geometric configuration and<br />
traffic control measures. Given the traffic distribution<br />
discussed above, it may be desirable to allow free flow traffic<br />
<strong>Flathead</strong> <strong>County</strong> <strong>Transportation</strong> <strong>Plan</strong> <strong>–</strong> <strong>Phase</strong> <strong>II</strong><br />
along Columbia Falls Stage Road. This could be achieved by realigning this intersection to create a<br />
smooth curve along the northwest corner (see illustration). The eastern leg of Kelley Road could then be<br />
realigned to connect to the intersection at a 90‐degree angle. Stop control would then be provided<br />
along Kelley Road. Realigning the intersection in this fashion would allow for unobstructed movements<br />
for the majority of traffic. This will become increasingly important as traffic volumes increase at this<br />
intersection.<br />
Identified Issues:<br />
Photo 29: Columbia Falls Stage / Kelley Road<br />
Intersection; from top to bottom: looking west;<br />
looking south; looking east.<br />
Majority of intersection traffic occurs along Columbia Falls Stage<br />
Poor geometric configuration<br />
“T” intersection requires a stop along northern leg<br />
Increasing traffic volumes may prove to be problematic<br />
Existing <strong>Transportation</strong> System Page | 2‐51
<strong>Flathead</strong> <strong>County</strong> <strong>Transportation</strong> <strong>Plan</strong> <strong>–</strong> <strong>Phase</strong> <strong>II</strong><br />
6. Fairmont Road and MT Highway 35<br />
Photo 30: Fairmont Road / MT Highway 35; from top<br />
to bottom: looking east; looking west; looking north.<br />
and to increase the safety of the intersection.<br />
Identified Issues:<br />
The intersection of MT Highway 35 and Fairmont Road is<br />
located east of Kalispell and east of the <strong>Flathead</strong> River. MT<br />
Highway 35 is a two‐lane paved highway classified as a<br />
principal arterial. Fairmont Road is a two‐lane paved minor<br />
collector roadway that serves local traffic. The intersection of<br />
MT Highway 35 and Fairmont Road is a four‐way signalized<br />
intersection.<br />
This intersection was recently temporarily signalized and the<br />
data collection at this location occurred while the intersection<br />
was unsignalized. Assumed signal timing was used for the<br />
performance analysis of this intersection and may not reflect<br />
actual signal timing. A LOS of B during the AM peak hour and a<br />
LOS of A during the PM peak hour resulted from this<br />
performance analysis. A previous analysis of this intersection<br />
under unsignalized conditions indicates a failing LOS during AM<br />
and PM peak hours.<br />
The vast majority of traffic at this intersection occurs along MT<br />
Highway 35. Turn‐lanes are not currently provided along any<br />
of the intersection legs. As traffic volumes increase, turn lanes<br />
off of MT Highway 35 may be needed.<br />
There were four crashes at this location during the three‐year<br />
crash analysis period. The crash analysis period occurred while<br />
the intersection was unsignalized. Two of these crashes<br />
resulted in injuries. It is unknown how the safety of this<br />
intersection has changed since its recent signalization.<br />
MT Highway 35 has a speed limit of 65 mph at this location,<br />
which could result in potentially hazardous situations at this<br />
location. Advance intersection warning signs may be needed<br />
to help identify the traffic signal along this high‐speed highway<br />
High speeds along MT Highway 35<br />
Vast majority of traffic occurs along MT Highway 35<br />
Historically high rate of crashes<br />
Potential for turn lanes along MT Highway 35<br />
Traffic signal is temporary and should be permanently constructed<br />
Advance intersection warning signs needed<br />
2‐52 | P age Existing <strong>Transportation</strong> System
7. Helena Flats Road and East Evergreen Drive<br />
The intersection of Helena Flats Road and East Evergreen Drive<br />
is located in Evergreen, just east of Kalispell. Helena Flats Road<br />
is a two‐lane paved roadway classified as a minor arterial.<br />
Helena Flats Road connects to MT Highway 35 and provides an<br />
alternate north/south corridor to LaSalle Road / US Highway 2.<br />
East Evergreen Drive is a two‐lane paved roadway and is<br />
classified as a minor arterial west of the intersection with<br />
Helena Flats Road. Evergreen Drive is a major east/west<br />
corridor and connects to Whitefish Stage. A bike/ped path<br />
exists along the north side of East Evergreen Drive.<br />
The intersection of Helena Flats Road and East Evergreen Drive<br />
is a four‐legged intersection with stop control along East<br />
Evergreen Drive. East Evergreen School is located along East<br />
Evergreen Drive near the intersection with Helena Flats Road.<br />
A crosswalk is provided across the northern leg of this<br />
intersection.<br />
There were two reported crashes at this intersection during<br />
the three‐year study period. Both crashes involved two<br />
vehicles, one of which resulted in a non‐incapacitating injury.<br />
A LOS analysis completed for this intersection shows that it<br />
currently functions at a LOS of B during AM and PM peak<br />
hours. The vast majority of traffic occurring at this intersection<br />
occurs along Helena Flats Road as straight through<br />
movements. One concern regarding this intersection is the<br />
amount of vegetation present at the corners of the<br />
intersection. Care should be taken to trim vegetation so that<br />
sight distance and traffic control signs are not obstructed.<br />
It is expected that this intersection, particularly along Helena<br />
Flats Road, will see an increase in traffic volumes due to its use<br />
as a “bypass” to LaSalle Road / US Highway 2. At this time, the<br />
intersection functions adequately; however, if traffic volumes<br />
increase, or traffic patterns change, this intersection should be<br />
analyzed in more detail to determine if a change in traffic<br />
control devices, or the addition of turn‐lanes, may be needed.<br />
Identified Issues:<br />
Majority of intersection traffic occurs along Helena<br />
Flats Road<br />
Vegetation obstructs sight distances and/or traffic signs<br />
East Evergreen School is located near the intersection<br />
Increasing use as a “bypass” to LaSalle Road / US Highway 2<br />
Likely increasing ADT may result in intersection performance issues<br />
<strong>Flathead</strong> <strong>County</strong> <strong>Transportation</strong> <strong>Plan</strong> <strong>–</strong> <strong>Phase</strong> <strong>II</strong><br />
Photo 31: Helena Flats Road / East Evergreen Drive<br />
Intersection; from top to bottom: looking west;<br />
looking south; looking east; looking north.<br />
Existing <strong>Transportation</strong> System Page | 2‐53
<strong>Flathead</strong> <strong>County</strong> <strong>Transportation</strong> <strong>Plan</strong> <strong>–</strong> <strong>Phase</strong> <strong>II</strong><br />
8. Helena Flats Road and East Reserve Drive<br />
Photo 32: Helena Flats Road / East Reserve Drive;<br />
from top to bottom: looking east; looking west;<br />
looking south; looking north.<br />
The intersection of Helena Flats Road and East Reserve Drive is<br />
located in Evergreen, northeast of Kalispell. Helena Flats Road<br />
is a two‐lane paved roadway classified as a minor arterial.<br />
Helena Flats Road connects to MT Highway 35 and provides an<br />
alternate north/south corridor to LaSalle Road / US Highway 2.<br />
East Reserve Drive is a two‐lane paved roadway classified as a<br />
minor arterial west of Helena Flats Road and as a minor<br />
collector east of Helena Flats Road. The intersection of Helena<br />
Flats Road and East Reserve Drive is a four‐way stop‐controlled<br />
intersection. It should be noted that the four‐way stop‐<br />
controlled intersection is the most restrictive form of<br />
intersection traffic control and often results in increased delay<br />
and vehicle emissions.<br />
There were no reported crashes at this intersection during the<br />
three‐year study period. The LOS analysis performed for this<br />
intersection shows that the intersection currently functions at<br />
a LOS of A during AM and PM peak hours. The traffic<br />
distribution at this intersection shows that the southern leg<br />
sees the most use, while the eastern leg experiences the least<br />
amount of traffic. In general, the majority of the traffic is<br />
traveling south to west through the intersection during the AM<br />
peak hour, while during the PM peak hour traffic is fairly well<br />
distributed along all legs.<br />
One concern regarding this intersection is that there are some<br />
sight distance issues along the northwest corner. There is a<br />
large fence along the northwest corner at this location that<br />
obstructs the view along the northern and western approach<br />
legs. While the crash analysis does not indicate that this has<br />
been an issue, as traffic volumes continue to rise, the<br />
obstructed sight distance may become problematic.<br />
It is expected that this intersection will experience an increase<br />
in traffic volumes as development occurs in the area and as<br />
these corridors see an increase in use as a “bypass” to MT<br />
Highway 35 and LaSalle Road / US Highway 2. While this<br />
intersection presently functions at an acceptable LOS, the<br />
performance should be monitored as development pressures<br />
are realized and as traffic volumes ultimately grow.<br />
Identified Issues:<br />
Limited sight distance along northwest corner<br />
Increasing traffic volumes<br />
Four‐way stop control<br />
2‐54 | P age Existing <strong>Transportation</strong> System
9. Hodgson Road and Whitefish Stage<br />
The intersection of Hodgson Road and Whitefish Stage is<br />
located between Kalispell and Whitefish. Whitefish Stage is a<br />
two‐lane paved roadway classified as a minor arterial and<br />
serves as an alternate north/south corridor to US Highway 93<br />
which runs between Whitefish and Kalispell. Hodgson Road is<br />
a two‐lane paved major collector roadway which runs between<br />
US Highway 93 and US Highway 2. Hodgson Road generally<br />
serves local traffic and residential neighborhoods in addition to<br />
providing east/west connection between the two highways.<br />
The intersection of Hodgson Road and Whitefish Stage is a<br />
four‐legged intersection with stop control along Hodgson<br />
Road. Six crashes were reported at this intersection during the<br />
three‐year study period. Of the six crashes, two resulted in<br />
injuries, none of which were incapacitating. The intersection<br />
has a crash rate of 1.69 crashes per million entering vehicles.<br />
This intersection had the highest number of crashes and the<br />
second highest crash rate of the study intersections over the<br />
three‐year analysis period.<br />
A performance analysis completed for this intersection<br />
indicates that the intersection performs at a LOS of B during<br />
the AM and PM peak hours. The traffic volumes are fairly<br />
evenly distributed along all four intersection legs. No<br />
proportionally heavy traffic movements are apparent at this<br />
intersection.<br />
The main concern with this intersection is the skewed western<br />
approach leg. The geometrics of this leg are awkward and<br />
restrict sight distance which results in safety issues. The high<br />
number of crashes occurring at this intersection may at least<br />
partially be attributed to the poor intersection alignment.<br />
Identified Issues:<br />
High rate of crashes<br />
Skewed western approach leg<br />
Limited sight distance<br />
<strong>Flathead</strong> <strong>County</strong> <strong>Transportation</strong> <strong>Plan</strong> <strong>–</strong> <strong>Phase</strong> <strong>II</strong><br />
Photo 33: Hodgson Road / Whitefish Stage; from top<br />
to bottom: looking west; looking south; looking east;<br />
looking north.<br />
Existing <strong>Transportation</strong> System Page | 2‐55
<strong>Flathead</strong> <strong>County</strong> <strong>Transportation</strong> <strong>Plan</strong> <strong>–</strong> <strong>Phase</strong> <strong>II</strong><br />
10. Kila Road and US Highway 2<br />
Photo 34: Kila Road / US Highway 2; from top to<br />
bottom: looking south; looking west; looking north.<br />
Identified Issues:<br />
High rate of crashes<br />
Skewed eastern approach leg<br />
Limited sight distances<br />
Southbound left‐turn lane may be needed<br />
The intersection of Kila Road and US Highway 2 is located in<br />
Kila, south of Kalispell. Kila Road is a two‐lane paved roadway<br />
classified as a major collector. This corridor is used to access<br />
the small community of Kila off of US Highway 2. Kila School is<br />
also accessed via Kila Road. US Highway 2 is a two‐lane paved<br />
highway classified as a principal arterial.<br />
The intersection of Kila Road and US Highway 2 is a three‐<br />
legged intersection with stop control along Kila Road. This<br />
intersection is very skewed and as a result has limited sight<br />
distance. Five crashes were reported at this location during<br />
the three‐year analysis period. Of the five crashes, three<br />
resulted in injuries, none of which were incapacitating. This<br />
intersection had the third highest number of crashes and the<br />
third highest crash rate of the study intersections.<br />
A performance analysis of this intersection shows that the<br />
intersection functions at a LOS of B during the AM peak hour<br />
and at a LOS of A during the PM peak hour. A look at the<br />
turning movement counts performed at this intersection<br />
shows that almost all of the traffic accessing US Highway 2 at<br />
this location is turning right off of Kila Road. The counts also<br />
show that almost all of the traffic accessing Kila Road from US<br />
Highway 2 at this location is turning left from US Highway 2.<br />
An initial look at the “Volume Guidelines for Left‐Turn Lanes at<br />
Unsignalized Intersections on 2‐Lane Highways” contained in<br />
MDT’s Traffic Engineering Manual indicates that a southbound<br />
left‐turn lane should be considered at this location based on<br />
current traffic volumes. Currently, vehicles stopping to turn<br />
left onto Kila Road are interrupting US Highway 2 traffic flow.<br />
2‐56 | P age Existing <strong>Transportation</strong> System
11. West Springcreek Road and US Highway 2<br />
The intersection of West Springcreek Road and US Highway 2 is<br />
located west of Kalispell. West Springcreek Road is a two‐lane<br />
paved principal arterial roadway that serves local and regional<br />
traffic along the western edge of Kalispell. US Highway 2 is a<br />
two‐lane paved highway classified as a principal arterial.<br />
The intersection of West Springcreek Road and US Highway 2 is<br />
a four‐legged intersection with stop control along West<br />
Springcreek Road and Dern Road. A flashing signal currently<br />
exists at this location which provides a flashing red light for the<br />
West Springcreek Road and Dern Road legs and flashes yellow<br />
for the US Highway 2 legs. Poor sight distance currently exists<br />
at the southwest corner of this intersection. This intersection<br />
has a high percentage of truck traffic which utilizes West<br />
Sringcreek Road to connect to Reserve Drive and US Highway<br />
93 in order to “bypass” the City of Kalispell.<br />
There were six reported crashes at this intersection during the<br />
three‐year study period. Of these six crashes, five resulted in<br />
injuries, none of which were incapacitating. This intersection<br />
had the highest number of crashes, the third highest severity<br />
index, and the fourth highest crash rate, which resulted in the<br />
highest composite rating of all the study intersections.<br />
The performance analysis conducted for this intersection<br />
indicates that it performs at a LOS of F during the AM peak<br />
hour and at a LOS of D during the PM peak hour. The poor<br />
performance of the intersection can largely be attributed to<br />
the inability of traffic along West Springcreek Road and Dern<br />
Road to access US Highway 2 due to the high traffic volumes<br />
along the highway. A preliminary signal warrant analysis<br />
performed for this intersection indicates that signal warrants<br />
were met for the 4‐hour and peak hour traffic volumes. This<br />
intersection should be analyzed in more detail to determine if<br />
a traffic signal or other traffic control device is appropriate for<br />
this location.<br />
Identified Issues:<br />
Highest composite crash rating<br />
Limited sight distance along southwestern corner<br />
Failing LOS during AM and PM peak hours<br />
Preliminary signal warrant analysis indicates a signal<br />
may be warranted<br />
High percentage of truck traffic<br />
Steep grade along Dern Road<br />
<strong>Flathead</strong> <strong>County</strong> <strong>Transportation</strong> <strong>Plan</strong> <strong>–</strong> <strong>Phase</strong> <strong>II</strong><br />
Photo 35: West Springcreek Road / US Highway 2;<br />
from top to bottom: looking east; looking west;<br />
looking south; looking north.<br />
Existing <strong>Transportation</strong> System Page | 2‐57
<strong>Flathead</strong> <strong>County</strong> <strong>Transportation</strong> <strong>Plan</strong> <strong>–</strong> <strong>Phase</strong> <strong>II</strong><br />
12. West Valley Drive and Three Mile Drive<br />
Photo 36: West Valley Drive / Three Mile Drive; from<br />
top to bottom: looking east; looking south; looking<br />
north.<br />
Identified Issues:<br />
High rate of crashes<br />
Yield signs placed along higher volume legs<br />
The intersection of West Valley Drive and Three Mile Drive is<br />
located west of Kalispell. West Valley Drive is a two‐lane paved<br />
minor collector roadway that serves local traffic in the area.<br />
Three Mile Drive is a two‐lane paved roadway classified as a<br />
minor collector west of West Valley Drive and as a major<br />
collector east of West Valley Drive. Three Mile Drive generally<br />
serves local traffic in the region.<br />
This intersection is a four‐legged intersection with yield signs<br />
along West Valley Drive. There have been three reported<br />
crashes at this intersection during the three‐year analysis<br />
period. Two of the crashes resulted in injuries, none of which<br />
were incapacitating. This intersection has the highest crash<br />
rate and fourth highest severity index, resulting in the second<br />
highest composite rating among the study intersections.<br />
The performance analysis conducted for this intersection<br />
indicates that it functions at a LOS of A during both the AM and<br />
PM peak hours. A look at the traffic patterns indicate that a<br />
vast majority of the traffic entering this intersection occurs<br />
along West Valley Drive. It would seem better suited to move<br />
the traffic control signs from West Valley Drive and place them<br />
along the Three Mile Drive approaches.<br />
In general this intersection performs quite well. There is<br />
minimal traffic delay and the sight distance seems adequate<br />
along all corners. Despite the low traffic volumes and minimal<br />
delay, this intersection did have a high crash rate resulting in<br />
1.92 crashes per million entering vehicles. This high crash rate<br />
may at least partially be due to the traffic control signs being<br />
placed along the higher volume legs of the intersection instead<br />
of being placed along the lower volume legs. This may cause<br />
confusion amongst users resulting in unsafe conditions.<br />
2‐58 | P age Existing <strong>Transportation</strong> System
13. Whitefish Stage and Granrud Lane<br />
The intersection of Whitefish Stage and Granrud Lane is<br />
located north of Kalispell. Granrud Lane is a two‐lane paved<br />
roadway classified as a minor collector and serves local and<br />
residential traffic in the area. Whitefish Stage is a two‐lane<br />
paved roadway and is classified as a minor arterial. Whitefish<br />
Stage serves local and regional traffic in the area and also<br />
provides an alternate north/south route to US Highway 93 and<br />
US Highway 2.<br />
This intersection is a three‐legged intersection with stop<br />
control along Granrud Lane. There were two reported crashes<br />
during the three‐year analysis period, one of which resulted in<br />
an incapacitating injury. A performance analysis of this<br />
intersection indicates that the intersection performs at a LOS<br />
of B during the AM and PM peak hours. Granrud Lane has<br />
relatively low traffic volumes at the intersection with Whitefish<br />
Stage.<br />
Overall, this intersection performs adequately for the amount<br />
of traffic that it handles. The relatively limited use along<br />
Granrud Lane contributes to the high performance level of the<br />
intersection. This intersection is geometrically sound and has<br />
good sight distance in all directions. If traffic volumes continue<br />
to rise in the future, this intersection should be monitored to<br />
determine if turn lanes along Whitefish Stage are justified.<br />
One concern regarding this intersection is the treatment of the<br />
shared‐use path which crosses the Granrud Lane leg of the<br />
intersection. There are no pavement markings or signs<br />
indicating that pedestrians and/or bicyclists may be crossing at<br />
this location. This could result in potentially hazardous<br />
situations.<br />
Identified Issues:<br />
One incapacitating injury occurred during the analysis period<br />
Lack of treatment for the shared‐use path crossing<br />
Turn lanes off of Whitefish Stage may be needed in the future<br />
<strong>Flathead</strong> <strong>County</strong> <strong>Transportation</strong> <strong>Plan</strong> <strong>–</strong> <strong>Phase</strong> <strong>II</strong><br />
Photo 37: Whitefish Stage / Granrud Lane; from top<br />
to bottom: looking north; looking east; looking south.<br />
Existing <strong>Transportation</strong> System Page | 2‐59
<strong>Flathead</strong> <strong>County</strong> <strong>Transportation</strong> <strong>Plan</strong> <strong>–</strong> <strong>Phase</strong> <strong>II</strong><br />
14. Whitefish Stage and Mission Trail<br />
Photo 38: Whitefish Stage / Mission Trail; from top to<br />
bottom: looking south; looking west; looking north.<br />
The intersection of Whitefish Stage and Mission Trail is located<br />
north of Kalispell. Mission Trail is a two‐lane paved roadway<br />
and is used primarily for residential access. Whitefish Stage is<br />
a two‐lane paved roadway and is classified as a minor arterial.<br />
Whitefish Stage serves local and regional traffic in the area and<br />
also provides an alternate north/south route to US Highway 93<br />
and US Highway 2.<br />
This intersection is a three‐legged intersection with stop<br />
control along Mission Trail. There were no reported crashes<br />
during the three‐year analysis period. A performance analysis<br />
of this intersection indicates that the intersection performs at<br />
a LOS of C during the AM and PM peak hours. The vast<br />
majority of the vehicles traveling along Mission Trail are<br />
turning left at the intersection to head south towards Kalispell.<br />
Similarly, the majority of vehicles turning onto Mission Trail are<br />
right‐turns off of Whitefish Stage.<br />
Overall, this intersection performs adequately for the amount<br />
of traffic that it handles. The relatively limited use along<br />
Mission Trail contributes to the high performance level of the<br />
intersection. This intersection is geometrically sound and has<br />
good sight distance in all directions. If traffic volumes continue<br />
to rise in the future, this intersection should be monitored to<br />
determine if turn lanes off of Whitefish Stage are justified. In<br />
the future, as the LOS decreases, additional traffic control<br />
device may be needed.<br />
One concern regarding this intersection is that there is a<br />
crosswalk across the northern leg of the intersection which<br />
connects to the shared‐use path along Whitefish Stage. The<br />
crosswalk leads directly to the shoulder and ditch along<br />
Mission Trail as there is no sidewalk or trail provided at this location. This could lead to pedestrians<br />
and/or bicyclists sharing the narrow roadway along Mission Trail with motorists.<br />
Identified Issues:<br />
Crosswalk across Whitefish Stage does not connect to a path or sidewalk along Mission Trail<br />
Monitor to determine if traffic control device and/or turn lanes are needed in the future<br />
2‐60 | P age Existing <strong>Transportation</strong> System
15. Whitefish Stage and West Evergreen Drive<br />
The intersection of Whitefish Stage and West Evergreen Drive<br />
is located north of Kalispell. West Evergreen Drive is a two‐<br />
lane paved roadway classified as a minor arterial. West<br />
Evergreen Drive serves local and regional traffic in the area.<br />
Whitefish Stage is a two‐lane paved roadway and is classified<br />
as a minor arterial. Whitefish Stage serves local and regional<br />
traffic in the area and also provides an alternate north/south<br />
route to US Highway 93 and US Highway 2.<br />
This intersection is a three‐legged intersection with stop<br />
control along West Evergreen Drive. There were three<br />
reported crashes at this intersection during the three‐year<br />
analysis period. Of these crashes, two resulted in injuries,<br />
none of which were incapacitating. The Village Plaza Shopping<br />
Center is located at the northeast corner of this intersection.<br />
Edgerton School is also located nearby.<br />
A performance analysis of this intersection indicates that the<br />
intersection performs at a LOS of C during the AM peak hour<br />
and at a LOS of F during the PM peak hour. The poor<br />
performance of the intersection indicates that some form of<br />
traffic control measure may be needed at this intersection.<br />
Currently, there are no designated turn‐lanes off of Whitefish<br />
Stage at this intersection. The high number of turning vehicles<br />
and poor LOS may indicate a need to add a right and/or left‐<br />
turn bay(s) off of Whitefish Stage. A preliminary signal warrant<br />
analysis for this intersection indicates that warrants may be<br />
met for the peak hour traffic warrant. This intersection should<br />
be analyzed in more detail to determine if a traffic signal or<br />
other traffic control device is appropriate for this location.<br />
Identified Issues:<br />
<strong>Flathead</strong> <strong>County</strong> <strong>Transportation</strong> <strong>Plan</strong> <strong>–</strong> <strong>Phase</strong> <strong>II</strong><br />
Poor PM peak hour LOS<br />
High volume of vehicles turning from Whitefish Stage<br />
Preliminary signal warrant analysis indicates a signal may be warranted<br />
School and area businesses located nearby<br />
Photo 39: Whitefish Stage / West Evergreen Drive;<br />
from top to bottom: looking west; looking south;<br />
looking north.<br />
Existing <strong>Transportation</strong> System Page | 2‐61
<strong>Flathead</strong> <strong>County</strong> <strong>Transportation</strong> <strong>Plan</strong> <strong>–</strong> <strong>Phase</strong> <strong>II</strong><br />
16. Whitefish Stage and Winchester Street<br />
Photo 40: Whitefish Stage / Winchester Street; from<br />
top to bottom: looking north; looking west; looking<br />
east; looking south.<br />
The intersection of Whitefish Stage and Winchester Street is<br />
located north of Kalispell. Winchester Street is a two‐lane<br />
paved roadway which is primarily used to access residential<br />
areas. Whitefish Stage is a two‐lane paved roadway and is<br />
classified as a minor arterial. Whitefish Stage serves local and<br />
regional traffic in the area and also provides an alternate<br />
north/south route to US Highway 93 and US Highway 2.<br />
This intersection is a four‐legged intersection with the western<br />
leg being an access to the Buffalo Hill Golf Club. Stop control is<br />
provided along the Golf Club access road and along Winchester<br />
Street. There were no reported crashes during the three‐year<br />
analysis period. A performance analysis of this intersection<br />
indicates that the intersection performs at a LOS of C during<br />
the AM and PM peak hours.<br />
Overall, this intersection performs adequately for the amount<br />
of traffic that it handles. If traffic volumes continue to rise in<br />
the future, this intersection should be monitored to determine<br />
if turn lanes or other traffic control measures are justified.<br />
Another concern regarding this intersection is that there is no<br />
signing for the crosswalk across the northern leg of the<br />
intersection. This may reduce the visibility of the crosswalk to<br />
oncoming motorists.<br />
Identified Issues:<br />
No signing for the crosswalk across Whitefish Stage<br />
Increasing traffic volumes may necessitate additional<br />
traffic control measures<br />
2‐62 | P age Existing <strong>Transportation</strong> System