Flathead County Transportation Plan – Phase II
Flathead County Transportation Plan – Phase II
Flathead County Transportation Plan – Phase II

You also want an ePaper? Increase the reach of your titles
YUMPU automatically turns print PDFs into web optimized ePapers that Google loves.
<strong>Flathead</strong> <strong>County</strong> <strong>Transportation</strong> <strong>Plan</strong> <strong>–</strong> <strong>Phase</strong> <strong>II</strong><br />
2.4.1 SIGNALIZED INTERSECTIONS<br />
The procedures used to evaluate signalized intersections use detailed information on geometry, lane<br />
use, signal timing, peak hour volumes, arrival types and other parameters. This information is then used<br />
to calculate delays and determine the capacity of each intersection. Generally, an intersection is<br />
determined to be functioning adequately if operating at LOS C or better.<br />
For signalized intersections, recent research has determined that “average control delay” per vehicle is<br />
the best available measure of level of service. The amount of control delay that a vehicle experiences<br />
is approximately equal to the time elapsed from when a vehicle joins a queue at the intersection (or<br />
arrives at the stop line when there is no queue) until the vehicle departs from the stopped position at<br />
the head of the queue. Control delay takes into account uniform delay, incremental delay, and initial<br />
queue delay. The control delay is primarily a function of volume, capacity, cycle length, green ratio, and<br />
the pattern of vehicle arrivals. Table 2.3 defines LOS in terms of average control delay per vehicle.<br />
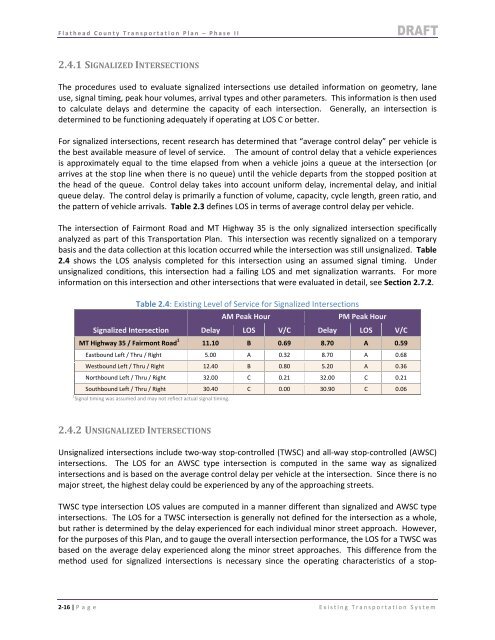
The intersection of Fairmont Road and MT Highway 35 is the only signalized intersection specifically<br />
analyzed as part of this <strong>Transportation</strong> <strong>Plan</strong>. This intersection was recently signalized on a temporary<br />
basis and the data collection at this location occurred while the intersection was still unsignalized. Table<br />
2.4 shows the LOS analysis completed for this intersection using an assumed signal timing. Under<br />
unsignalized conditions, this intersection had a failing LOS and met signalization warrants. For more<br />
information on this intersection and other intersections that were evaluated in detail, see Section 2.7.2.<br />
Signalized Intersection<br />
Table 2.4: Existing Level of Service for Signalized Intersections<br />
AM Peak Hour PM Peak Hour<br />
Delay LOS V/C Delay LOS V/C<br />
MT Highway 35 / Fairmont Road 1 11.10 B 0.69 8.70 A 0.59<br />
Eastbound Left / Thru / Right 5.00 A 0.32 8.70 A 0.68<br />
Westbound Left / Thru / Right 12.40 B 0.80 5.20 A 0.36<br />
Northbound Left / Thru / Right 32.00 C 0.21 32.00 C 0.21<br />
Southbound Left / Thru / Right 30.40 C 0.00 30.90 C 0.06<br />
1 Signal timing was assumed and may not reflect actual signal timing.<br />
2.4.2 UNSIGNALIZED INTERSECTIONS<br />
Unsignalized intersections include two‐way stop‐controlled (TWSC) and all‐way stop‐controlled (AWSC)<br />
intersections. The LOS for an AWSC type intersection is computed in the same way as signalized<br />
intersections and is based on the average control delay per vehicle at the intersection. Since there is no<br />
major street, the highest delay could be experienced by any of the approaching streets.<br />
TWSC type intersection LOS values are computed in a manner different than signalized and AWSC type<br />
intersections. The LOS for a TWSC intersection is generally not defined for the intersection as a whole,<br />
but rather is determined by the delay experienced for each individual minor street approach. However,<br />
for the purposes of this <strong>Plan</strong>, and to gauge the overall intersection performance, the LOS for a TWSC was<br />
based on the average delay experienced along the minor street approaches. This difference from the<br />
method used for signalized intersections is necessary since the operating characteristics of a stop‐<br />
2‐16 | P age Existing <strong>Transportation</strong> System