Flathead County Transportation Plan – Phase II
Flathead County Transportation Plan – Phase II
Flathead County Transportation Plan – Phase II

Create successful ePaper yourself
Turn your PDF publications into a flip-book with our unique Google optimized e-Paper software.
<strong>Flathead</strong> <strong>County</strong> <strong>Transportation</strong> <strong>Plan</strong> <strong>–</strong> <strong>Phase</strong> <strong>II</strong><br />
2.6.2 INTERSECTION CRASH ANALYSIS<br />
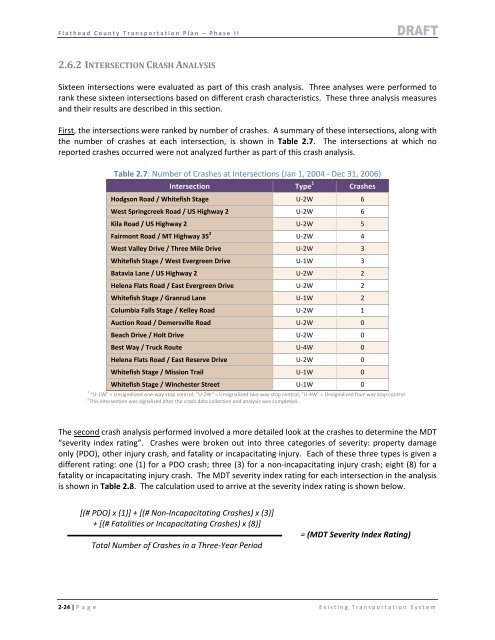
Sixteen intersections were evaluated as part of this crash analysis. Three analyses were performed to<br />
rank these sixteen intersections based on different crash characteristics. These three analysis measures<br />
and their results are described in this section.<br />
First, the intersections were ranked by number of crashes. A summary of these intersections, along with<br />
the number of crashes at each intersection, is shown in Table 2.7. The intersections at which no<br />
reported crashes occurred were not analyzed further as part of this crash analysis.<br />
Table 2.7: Number of Crashes at Intersections (Jan 1, 2004 ‐ Dec 31, 2006)<br />
Intersection Type 1<br />
Crashes<br />
Hodgson Road / Whitefish Stage U‐2W 6<br />
West Springcreek Road / US Highway 2 U‐2W 6<br />
Kila Road / US Highway 2 U‐2W 5<br />
Fairmont Road / MT Highway 35 2 U‐2W 4<br />
West Valley Drive / Three Mile Drive U‐2W 3<br />
Whitefish Stage / West Evergreen Drive U‐1W 3<br />
Batavia Lane / US Highway 2 U‐2W 2<br />
Helena Flats Road / East Evergreen Drive U‐2W 2<br />
Whitefish Stage / Granrud Lane U‐1W 2<br />
Columbia Falls Stage / Kelley Road U‐2W 1<br />
Auction Road / Demersville Road U‐2W 0<br />
Beach Drive / Holt Drive U‐2W 0<br />
Best Way / Truck Route U‐4W 0<br />
Helena Flats Road / East Reserve Drive U‐2W 0<br />
Whitefish Stage / Mission Trail U‐1W 0<br />
Whitefish Stage / Winchester Street U‐1W 0<br />
1 “U‐1W" = Unsignalized one‐way stop control; "U‐2W" = Unsignalized two‐way stop control; "U‐4W" = Unsignalized four‐way stop control.<br />
2 This intersection was signalized after the crash data collection and analysis was completed.<br />
The second crash analysis performed involved a more detailed look at the crashes to determine the MDT<br />
“severity index rating”. Crashes were broken out into three categories of severity: property damage<br />
only (PDO), other injury crash, and fatality or incapacitating injury. Each of these three types is given a<br />
different rating: one (1) for a PDO crash; three (3) for a non‐incapacitating injury crash; eight (8) for a<br />
fatality or incapacitating injury crash. The MDT severity index rating for each intersection in the analysis<br />
is shown in Table 2.8. The calculation used to arrive at the severity index rating is shown below.<br />
[(# PDO) x (1)] + [(# Non‐Incapacitating Crashes) x (3)]<br />
+ [(# Fatalities or Incapacitating Crashes) x (8)]<br />
Total Number of Crashes in a Three‐Year Period<br />
= (MDT Severity Index Rating)<br />
2‐24 | P age Existing <strong>Transportation</strong> System