Burrard Inlet Environmental Indicators Report - the BIEAP and ...
Burrard Inlet Environmental Indicators Report - the BIEAP and ...
Burrard Inlet Environmental Indicators Report - the BIEAP and ...

You also want an ePaper? Increase the reach of your titles
YUMPU automatically turns print PDFs into web optimized ePapers that Google loves.
<strong>Burrard</strong> <strong>Inlet</strong> <strong>Environmental</strong> <strong>Indicators</strong> <strong>Report</strong> February 2008<br />
<strong>BIEAP</strong> remains committed to translating information into action. As our underst<strong>and</strong>ing of <strong>the</strong><br />
connections between a healthy environment, society <strong>and</strong> economy deepens, we learn about<br />
<strong>the</strong> many actions that individuals, communities, businesses <strong>and</strong> corporations can take to<br />
maintain <strong>the</strong> health of <strong>Burrard</strong> <strong>Inlet</strong>.<br />
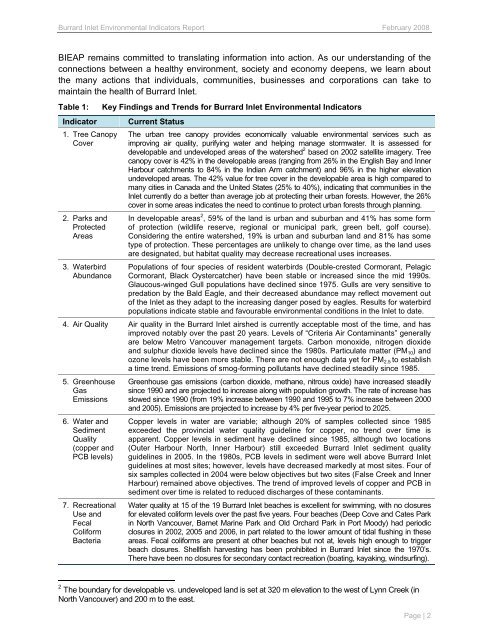
Table 1: Key Findings <strong>and</strong> Trends for <strong>Burrard</strong> <strong>Inlet</strong> <strong>Environmental</strong> <strong>Indicators</strong><br />
Indicator Current Status<br />
1. Tree Canopy<br />
Cover<br />
2. Parks <strong>and</strong><br />
Protected<br />
Areas<br />
3. Waterbird<br />
Abundance<br />
The urban tree canopy provides economically valuable environmental services such as<br />
improving air quality, purifying water <strong>and</strong> helping manage stormwater. It is assessed for<br />
developable <strong>and</strong> undeveloped areas of <strong>the</strong> watershed 2 based on 2002 satellite imagery. Tree<br />
canopy cover is 42% in <strong>the</strong> developable areas (ranging from 26% in <strong>the</strong> English Bay <strong>and</strong> Inner<br />
Harbour catchments to 84% in <strong>the</strong> Indian Arm catchment) <strong>and</strong> 96% in <strong>the</strong> higher elevation<br />
undeveloped areas. The 42% value for tree cover in <strong>the</strong> developable area is high compared to<br />
many cities in Canada <strong>and</strong> <strong>the</strong> United States (25% to 40%), indicating that communities in <strong>the</strong><br />
<strong>Inlet</strong> currently do a better than average job at protecting <strong>the</strong>ir urban forests. However, <strong>the</strong> 26%<br />
cover in some areas indicates <strong>the</strong> need to continue to protect urban forests through planning.<br />
In developable areas 2 , 59% of <strong>the</strong> l<strong>and</strong> is urban <strong>and</strong> suburban <strong>and</strong> 41% has some form<br />
of protection (wildlife reserve, regional or municipal park, green belt, golf course).<br />
Considering <strong>the</strong> entire watershed, 19% is urban <strong>and</strong> suburban l<strong>and</strong> <strong>and</strong> 81% has some<br />
type of protection. These percentages are unlikely to change over time, as <strong>the</strong> l<strong>and</strong> uses<br />
are designated, but habitat quality may decrease recreational uses increases.<br />
Populations of four species of resident waterbirds (Double-crested Cormorant, Pelagic<br />
Cormorant, Black Oystercatcher) have been stable or increased since <strong>the</strong> mid 1990s.<br />
Glaucous-winged Gull populations have declined since 1975. Gulls are very sensitive to<br />
predation by <strong>the</strong> Bald Eagle, <strong>and</strong> <strong>the</strong>ir decreased abundance may reflect movement out<br />
of <strong>the</strong> <strong>Inlet</strong> as <strong>the</strong>y adapt to <strong>the</strong> increasing danger posed by eagles. Results for waterbird<br />
populations indicate stable <strong>and</strong> favourable environmental conditions in <strong>the</strong> <strong>Inlet</strong> to date.<br />
4. Air Quality Air quality in <strong>the</strong> <strong>Burrard</strong> <strong>Inlet</strong> airshed is currently acceptable most of <strong>the</strong> time, <strong>and</strong> has<br />
improved notably over <strong>the</strong> past 20 years. Levels of “Criteria Air Contaminants” generally<br />
are below Metro Vancouver management targets. Carbon monoxide, nitrogen dioxide<br />
<strong>and</strong> sulphur dioxide levels have declined since <strong>the</strong> 1980s. Particulate matter (PM10) <strong>and</strong><br />
ozone levels have been more stable. There are not enough data yet for PM2.5 to establish<br />
a time trend. Emissions of smog-forming pollutants have declined steadily since 1985.<br />
5. Greenhouse<br />
Gas<br />
Emissions<br />
6. Water <strong>and</strong><br />
Sediment<br />
Quality<br />
(copper <strong>and</strong><br />
PCB levels)<br />
7. Recreational<br />
Use <strong>and</strong><br />
Fecal<br />
Coliform<br />
Bacteria<br />
Greenhouse gas emissions (carbon dioxide, methane, nitrous oxide) have increased steadily<br />
since 1990 <strong>and</strong> are projected to increase along with population growth. The rate of increase has<br />
slowed since 1990 (from 19% increase between 1990 <strong>and</strong> 1995 to 7% increase between 2000<br />
<strong>and</strong> 2005). Emissions are projected to increase by 4% per five-year period to 2025.<br />
Copper levels in water are variable; although 20% of samples collected since 1985<br />
exceeded <strong>the</strong> provincial water quality guideline for copper, no trend over time is<br />
apparent. Copper levels in sediment have declined since 1985, although two locations<br />
(Outer Harbour North, Inner Harbour) still exceeded <strong>Burrard</strong> <strong>Inlet</strong> sediment quality<br />
guidelines in 2005. In <strong>the</strong> 1980s, PCB levels in sediment were well above <strong>Burrard</strong> <strong>Inlet</strong><br />
guidelines at most sites; however, levels have decreased markedly at most sites. Four of<br />
six samples collected in 2004 were below objectives but two sites (False Creek <strong>and</strong> Inner<br />
Harbour) remained above objectives. The trend of improved levels of copper <strong>and</strong> PCB in<br />
sediment over time is related to reduced discharges of <strong>the</strong>se contaminants.<br />
Water quality at 15 of <strong>the</strong> 19 <strong>Burrard</strong> <strong>Inlet</strong> beaches is excellent for swimming, with no closures<br />
for elevated coliform levels over <strong>the</strong> past five years. Four beaches (Deep Cove <strong>and</strong> Cates Park<br />
in North Vancouver, Barnet Marine Park <strong>and</strong> Old Orchard Park in Port Moody) had periodic<br />
closures in 2002, 2005 <strong>and</strong> 2006, in part related to <strong>the</strong> lower amount of tidal flushing in <strong>the</strong>se<br />
areas. Fecal coliforms are present at o<strong>the</strong>r beaches but not at, levels high enough to trigger<br />
beach closures. Shellfish harvesting has been prohibited in <strong>Burrard</strong> <strong>Inlet</strong> since <strong>the</strong> 1970’s.<br />
There have been no closures for secondary contact recreation (boating, kayaking, windsurfing).<br />
2<br />
The boundary for developable vs. undeveloped l<strong>and</strong> is set at 320 m elevation to <strong>the</strong> west of Lynn Creek (in<br />
North Vancouver) <strong>and</strong> 200 m to <strong>the</strong> east.<br />
Page | 2