Burrard Inlet Environmental Indicators Report - the BIEAP and ...
Burrard Inlet Environmental Indicators Report - the BIEAP and ...
Burrard Inlet Environmental Indicators Report - the BIEAP and ...

You also want an ePaper? Increase the reach of your titles
YUMPU automatically turns print PDFs into web optimized ePapers that Google loves.
<strong>Burrard</strong> <strong>Inlet</strong> <strong>Environmental</strong> <strong>Indicators</strong> <strong>Report</strong> February 2008<br />
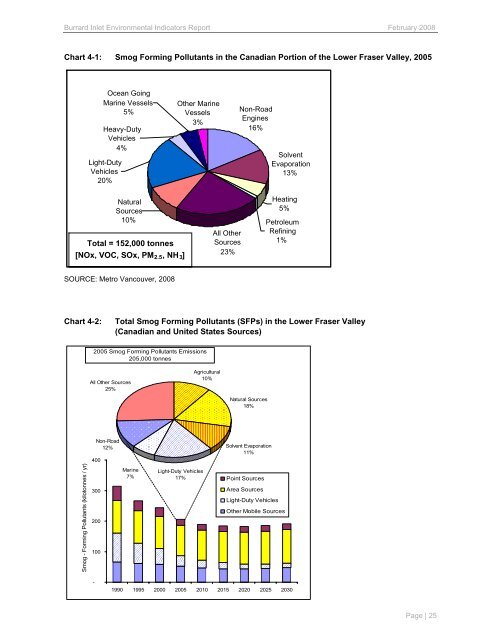
Chart 4-1: Smog Forming Pollutants in <strong>the</strong> Canadian Portion of <strong>the</strong> Lower Fraser Valley, 2005<br />
Ocean Going<br />
Marine Vessels<br />
5%<br />
Heavy-Duty<br />
Vehicles<br />
4%<br />
Light-Duty<br />
Vehicles<br />
20%<br />
Natural<br />
Sources<br />
10%<br />
Total = 152,000 tonnes<br />
[NOx, VOC, SOx, PM 2.5 , NH 3 ]<br />
SOURCE: Metro Vancouver, 2008<br />
O<strong>the</strong>r Marine<br />
Vessels<br />
3%<br />
All O<strong>the</strong>r<br />
Sources<br />
23%<br />
Non-Road<br />
Engines<br />
16%<br />
Solvent<br />
Evaporation<br />
13%<br />
Heating<br />
5%<br />
Petroleum<br />
Refining<br />
1%<br />
Chart 4-2: Total Smog Forming Pollutants (SFPs) in <strong>the</strong> Lower Fraser Valley<br />
(Canadian <strong>and</strong> United States Sources)<br />
Smog - Forming Pollutants (kilotonnes / yr)<br />
2005 Smog Forming Pollutants Emissions<br />
205,000 tonnes<br />
All O<strong>the</strong>r Sources<br />
25%<br />
400<br />
300<br />
200<br />
100<br />
-<br />
Non-Road<br />
12%<br />
Marine<br />
7%<br />
Light-Duty Vehicles<br />
17%<br />
Agricultural<br />
10%<br />
Natural Sources<br />
18%<br />
Solvent Evaporation<br />
11%<br />
Point Sources<br />
Area Sources<br />
Light-Duty Vehicles<br />
O<strong>the</strong>r Mobile Sources<br />
1990 1995 2000 2005 2010 2015 2020 2025 2030<br />
Page | 25