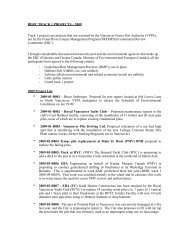
Burrard Inlet Environmental Indicators Report - the BIEAP and ...
Burrard Inlet Environmental Indicators Report - the BIEAP and ...
Burrard Inlet Environmental Indicators Report - the BIEAP and ...

Create successful ePaper yourself
Turn your PDF publications into a flip-book with our unique Google optimized e-Paper software.
<strong>Burrard</strong> <strong>Inlet</strong> <strong>Environmental</strong> <strong>Indicators</strong> <strong>Report</strong> February 2008<br />
List of Charts<br />
Chart 1-1: Current L<strong>and</strong> Cover across <strong>the</strong> Entire <strong>Burrard</strong> <strong>Inlet</strong> Watershed ..........................14<br />
Chart 1-2: Current L<strong>and</strong> Cover in Developable Areas of <strong>Burrard</strong> <strong>Inlet</strong>..................................14<br />
Chart 3-1: Waterbird Abundance in <strong>Burrard</strong> <strong>Inlet</strong> Since 1975...............................................21<br />
Chart 4-1: Smog Forming Pollutants in <strong>the</strong> Canadian Portion of <strong>the</strong> Lower Fraser<br />
Valley, 2005 .........................................................................................................25<br />
Chart 4-2: Total Smog Forming Pollutants (SFPs) in <strong>the</strong> Lower Fraser Valley<br />
(Canadian <strong>and</strong> United States Sources) ...............................................................25<br />
Chart 5-1: Total Annual Emissions of GHGs Within <strong>the</strong> <strong>Burrard</strong> <strong>Inlet</strong> Airshed<br />
(marine <strong>and</strong> l<strong>and</strong> sources, including vehicles) .....................................................29<br />
Chart 6-1: Copper Concentrations in <strong>Burrard</strong> <strong>Inlet</strong> Sediment (1985 to 2005).......................32<br />
Chart 6-2: PCB Concentration in <strong>Burrard</strong> <strong>Inlet</strong> Sediment (1985 to 2004) .............................33<br />
Chart 7-1: Number of Days <strong>Burrard</strong> <strong>Inlet</strong> Beaches were Closed for Swimming<br />
(2002 to 2006)......................................................................................................37<br />
Chart 7-2: Fecal Coliform Data for Deep Cove (2002 to 2006).............................................37<br />
Chart 7-3: Fecal Coliform Data for Old Orchard Park (2002 to 2006)...................................38<br />
Chart 7-4: Fecal Coliform Data for Sunset Beach (2002 to 2006) ........................................38<br />
List of Figures<br />
Figure 1: Examples of Contaminant Pathways in <strong>the</strong> <strong>Burrard</strong> <strong>Inlet</strong> <strong>and</strong> Strait of<br />
Georgia Ecosystems............................................................................................10<br />
Figure 5-1: Past <strong>and</strong> Future CO2 Levels in <strong>the</strong> Atmosphere ..................................................27<br />
Page | iii