NOTES TO THE FINANCIAL STATEMENTS for the year ended 30 September 2006 5 SEGMENT INFORMATION (cont’d) Year ended 30 September 2005 (Restated) The following table presents financial information regarding business segments: Printing & Glass Investment Development Soft Drinks Dairies Breweries Publishing Containers Property Property Others Elimination Group Business Segment ($’000) ($’000) ($’000) ($’000) ($’000) ($’000) ($’000) ($’000) ($’000) ($’000) Revenue – external 439,878 406,334 919,340 480,561 105,118 190,933 923,757 22,073 – 3,487,994 Revenue – inter-segment 5 49 – 328 17,491 2,480 – 80,657 (101,010) – Total revenue 439,883 406,383 919,340 480,889 122,609 193,413 923,757 102,730 (101,010) 3,487,994 Subsidiary companies 50,598 13,264 110,908 28,952 6,417 113,934 139,556 14,820 – 478,449 Joint venture <strong>and</strong> associated companies – 3,484 21,890 6,562 – (1,828) 16,032 – – 46,140 PBIT * 50,598 16,748 132,798 35,514 6,417 112,106 155,588 14,820 – 524,589 Interest income 20,104 Interest expense (61,043) Profit before taxation <strong>and</strong> exceptional items 483,650 Exceptional items 29,304 Profit before taxation 512,954 Taxation (137,354) Profit after taxation 375,600 Minority interest, net of taxes (79,947) Attributable profit 295,653 Assets 261,022 311,284 785,426 732,055 185,042 2,282,015 2,892,567 182,122 – 7,631,533 Tax assets 9,675 Bank deposits & cash balances 577,367 Total assets 8,218,575 Liabilities 103,774 72,045 178,683 128,100 21,449 94,787 272,871 35,687 – 907,396 Tax liabilities 238,287 Borrowings 3,354,997 Total liabilities 4,500,680 Other segment information: Capital expenditure 16,117 8,955 65,568 116,540 7,531 2,436 – 2,479 – 219,626 Depreciation & amortisation 14,283 15,687 33,273 28,626 18,018 3,422 18 3,586 – 116,913 Impairment losses 230 44 87 – – – – – – 361 Reversal of impairment losses (176) (10) (48) – – – – – – (234) Attributable profit before exceptional items 21,447 3,709 50,247 25,436 2,206 80,778 103,856 (16,711) – 270,968 Exceptional items (681) (787) (388) 5,631 – 1,433 2,543 16,934 – 24,685 Attributable profit 20,766 2,922 49,859 31,067 2,206 82,211 106,399 223 – 295,653 The following table presents financial information regarding geographical segments: Rest of South North South South Europe Singapore Malaysia East Asia East Asia Asia Pacific & USA Group Geographical Segment ($’000) ($’000) ($’000) ($’000) ($’000) ($’000) ($’000) ($’000) Total revenue 1,414,364 801,995 358,575 348,249 1,203 417,856 145,752 3,487,994 PBIT * 212,166 89,574 83,875 59,922 311 59,587 19,154 524,589 Other geographical information: Assets 4,291,658 640,415 409,202 1,228,402 3,686 635,888 422,282 7,631,533 Capital expenditure 50,500 42,384 28,765 44,890 – 47,894 5,193 219,626 * PBIT = Profit before interest, taxation <strong>and</strong> exceptional items Rest of South East Asia: Myanmar, Thail<strong>and</strong>, Cambodia <strong>and</strong> Vietnam North East Asia: China, Taiwan, Japan, Korea <strong>and</strong> Mongolia South Asia: India <strong>and</strong> Sri Lanka South Pacific: Australia <strong>and</strong> New Zeal<strong>and</strong> 114 <strong>Fraser</strong> <strong>and</strong> <strong>Neave</strong>, <strong>Limited</strong> & Subsidiary Companies Annual <strong>Report</strong> 2006
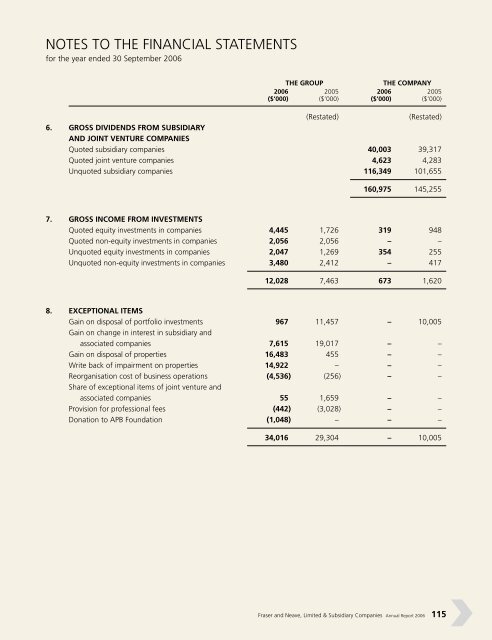
NOTES TO THE FINANCIAL STATEMENTS for the year ended 30 September 2006 THE GROUP THE COMPANY 2006 2005 2006 2005 ($’000) ($’000) ($’000) ($’000) (Restated) (Restated) 6. GROSS DIVIDENDS FROM SUBSIDIARY AND JOINT VENTURE COMPANIES Quoted subsidiary companies 40,003 39,317 Quoted joint venture companies 4,623 4,283 Unquoted subsidiary companies 116,349 101,655 160,975 145,255 7. GROSS INCOME FROM INVESTMENTS Quoted equity investments in companies 4,445 1,726 319 948 Quoted non-equity investments in companies 2,056 2,056 – – Unquoted equity investments in companies 2,047 1,269 354 255 Unquoted non-equity investments in companies 3,480 2,412 – 417 12,028 7,463 673 1,620 8. EXCEPTIONAL ITEMS Gain on disposal of portfolio investments 967 11,457 – 10,005 Gain on change in interest in subsidiary <strong>and</strong> associated companies 7,615 19,017 – – Gain on disposal of properties 16,483 455 – – Write back of impairment on properties 14,922 – – – Reorganisation cost of business operations (4,536) (256) – – Share of exceptional items of joint venture <strong>and</strong> associated companies 55 1,659 – – Provision for professional fees (442) (3,028) – – Donation to APB Foundation (1,048) – – – 34,016 29,304 – 10,005 <strong>Fraser</strong> <strong>and</strong> <strong>Neave</strong>, <strong>Limited</strong> & Subsidiary Companies Annual <strong>Report</strong> 2006 115