Full Report - Fraser and Neave Limited
Full Report - Fraser and Neave Limited
Full Report - Fraser and Neave Limited

Create successful ePaper yourself
Turn your PDF publications into a flip-book with our unique Google optimized e-Paper software.
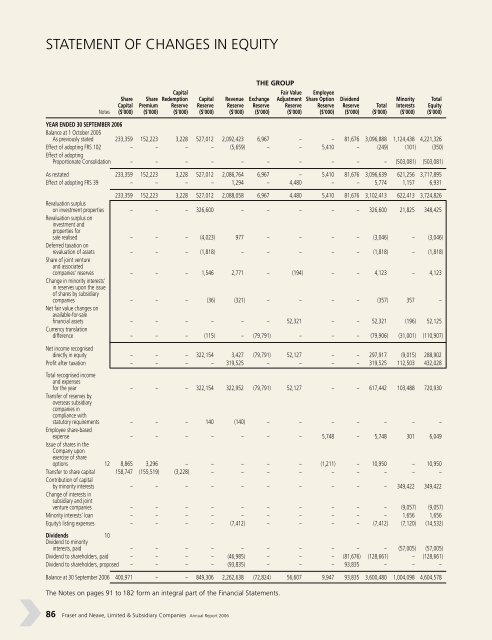
STATEMENT OF CHANGES IN EQUITY<br />
86 <strong>Fraser</strong> <strong>and</strong> <strong>Neave</strong>, <strong>Limited</strong> & Subsidiary Companies Annual <strong>Report</strong> 2006<br />
THE GROUP<br />
Capital Fair Value Employee<br />
Share Share Redemption Capital Revenue Exchange Adjustment Share Option Dividend Minority Total<br />
Capital Premium Reserve Reserve Reserve Reserve Reserve Reserve Reserve Total Interests Equity<br />
Notes ($’000) ($’000) ($’000) ($’000) ($’000) ($’000) ($’000) ($’000) ($’000) ($’000) ($’000) ($’000)<br />
YEAR ENDED 30 SEPTEMBER 2006<br />
Balance at 1 October 2005<br />
As previously stated 233,359 152,223 3,228 527,012 2,092,423 6,967 – – 81,676 3,096,888 1,124,438 4,221,326<br />
Effect of adopting FRS 102 – – – – (5,659) – – 5,410 – (249) (101) (350)<br />
Effect of adopting<br />
Proportionate Consolidation – – – – – – – – – – (503,081) (503,081)<br />
As restated 233,359 152,223 3,228 527,012 2,086,764 6,967 – 5,410 81,676 3,096,639 621,256 3,717,895<br />
Effect of adopting FRS 39 – – – – 1,294 – 4,480 – – 5,774 1,157 6,931<br />
233,359 152,223 3,228 527,012 2,088,058 6,967 4,480 5,410 81,676 3,102,413 622,413 3,724,826<br />
Revaluation surplus<br />
on investment properties<br />
Revaluation surplus on<br />
investment <strong>and</strong><br />
properties for<br />
– – – 326,600 – – – – – 326,600 21,825 348,425<br />
sale realised<br />
Deferred taxation on<br />
– – – (4,023) 977 – – – – (3,046) – (3,046)<br />
revaluation of assets<br />
Share of joint venture<br />
<strong>and</strong> associated<br />
– – – (1,818) – – – – – (1,818) – (1,818)<br />
companies’ reserves<br />
Change in minority interests’<br />
in reserves upon the issue<br />
of shares by subsidiary<br />
– – – 1,546 2,771 – (194) – – 4,123 – 4,123<br />
companies<br />
Net fair value changes on<br />
available-for-sale<br />
– – – (36) (321) – – – – (357) 357 –<br />
financial assets<br />
Currency translation<br />
– – – – – – 52,321 – – 52,321 (196) 52,125<br />
difference – – – (115) – (79,791) – – – (79,906) (31,001) (110,907)<br />
Net income recognised<br />
directly in equity – – – 322,154 3,427 (79,791) 52,127 – – 297,917 (9,015) 288,902<br />
Profit after taxation – – – – 319,525 – – – – 319,525 112,503 432,028<br />
Total recognised income<br />
<strong>and</strong> expenses<br />
for the year – – – 322,154 322,952 (79,791) 52,127 – – 617,442 103,488 720,930<br />
Transfer of reserves by<br />
overseas subsidiary<br />
companies in<br />
compliance with<br />
statutory requirements – – – 140 (140) – – – – – – –<br />
Employee share-based<br />
expense – – – – – – – 5,748 – 5,748 301 6,049<br />
Issue of shares in the<br />
Company upon<br />
exercise of share<br />
options 12 8,865 3,296 – – – – – (1,211) – 10,950 – 10,950<br />
Transfer to share capital 158,747 (155,519) (3,228) – – – – – – – – –<br />
Contribution of capital<br />
by minority interests – – – – – – – – – – 349,422 349,422<br />
Change of interests in<br />
subsidiary <strong>and</strong> joint<br />
venture companies – – – – – – – – – – (9,057) (9,057)<br />
Minority interests’ loan – – – – – – – – – – 1,656 1,656<br />
Equity’s listing expenses – – – – (7,412) – – – – (7,412) (7,120) (14,532)<br />
Dividends 10<br />
Dividend to minority<br />
interests, paid – – – – – – – – – – (57,005) (57,005)<br />
Dividend to shareholders, paid – – – – (46,985) – – – (81,676) (128,661) – (128,661)<br />
Dividend to shareholders, proposed – – – – (93,835) – – – 93,835 – – –<br />
Balance at 30 September 2006 400,971 – – 849,306 2,262,638 (72,824) 56,607 9,947 93,835 3,600,480 1,004,098 4,604,578<br />
The Notes on pages 91 to 182 form an integral part of the Financial Statements.