Full Report - Fraser and Neave Limited
Full Report - Fraser and Neave Limited
Full Report - Fraser and Neave Limited

You also want an ePaper? Increase the reach of your titles
YUMPU automatically turns print PDFs into web optimized ePapers that Google loves.
NOTES TO THE FINANCIAL STATEMENTS<br />
for the year ended 30 September 2006<br />
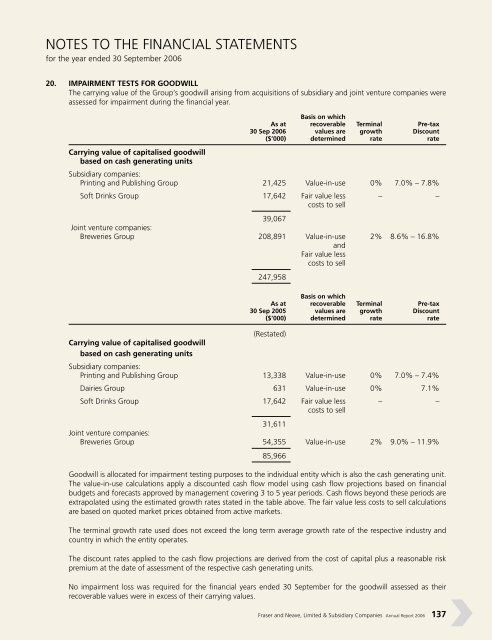
20. IMPAIRMENT TESTS FOR GOODWILL<br />
The carrying value of the Group’s goodwill arising from acquisitions of subsidiary <strong>and</strong> joint venture companies were<br />
assessed for impairment during the financial year.<br />
Carrying value of capitalised goodwill<br />
based on cash generating units<br />
Basis on which<br />
As at recoverable Terminal Pre-tax<br />
30 Sep 2006 values are growth Discount<br />
($’000) determined rate rate<br />
Subsidiary companies:<br />
Printing <strong>and</strong> Publishing Group 21,425 Value-in-use 0% 7.0% – 7.8%<br />
Soft Drinks Group 17,642 Fair value less – –<br />
costs to sell<br />
39,067<br />
Joint venture companies:<br />
Breweries Group 208,891 Value-in-use<br />
<strong>and</strong><br />
Fair value less<br />
costs to sell<br />
2% 8.6% – 16.8%<br />
Carrying value of capitalised goodwill<br />
based on cash generating units<br />
247,958<br />
Basis on which<br />
As at recoverable Terminal Pre-tax<br />
30 Sep 2005 values are growth Discount<br />
($’000) determined rate rate<br />
(Restated)<br />
Subsidiary companies:<br />
Printing <strong>and</strong> Publishing Group 13,338 Value-in-use 0% 7.0% – 7.4%<br />
Dairies Group 631 Value-in-use 0% 7.1%<br />
Soft Drinks Group 17,642 Fair value less – –<br />
costs to sell<br />
31,611<br />
Joint venture companies:<br />
Breweries Group 54,355 Value-in-use 2% 9.0% – 11.9%<br />
85,966<br />
Goodwill is allocated for impairment testing purposes to the individual entity which is also the cash generating unit.<br />
The value-in-use calculations apply a discounted cash flow model using cash flow projections based on financial<br />
budgets <strong>and</strong> forecasts approved by management covering 3 to 5 year periods. Cash flows beyond these periods are<br />
extrapolated using the estimated growth rates stated in the table above. The fair value less costs to sell calculations<br />
are based on quoted market prices obtained from active markets.<br />
The terminal growth rate used does not exceed the long term average growth rate of the respective industry <strong>and</strong><br />
country in which the entity operates.<br />
The discount rates applied to the cash flow projections are derived from the cost of capital plus a reasonable risk<br />
premium at the date of assessment of the respective cash generating units.<br />
No impairment loss was required for the financial years ended 30 September for the goodwill assessed as their<br />
recoverable values were in excess of their carrying values.<br />
<strong>Fraser</strong> <strong>and</strong> <strong>Neave</strong>, <strong>Limited</strong> & Subsidiary Companies Annual <strong>Report</strong> 2006 137