Market Opportunities for African Agriculture - International Food ...
Market Opportunities for African Agriculture - International Food ...
Market Opportunities for African Agriculture - International Food ...

Create successful ePaper yourself
Turn your PDF publications into a flip-book with our unique Google optimized e-Paper software.
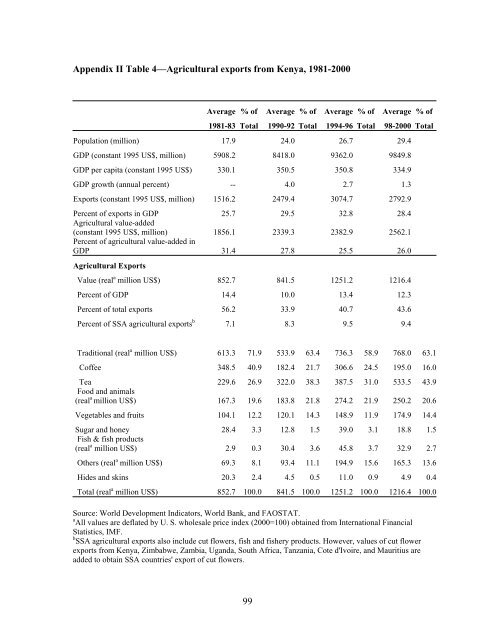
Appendix II Table 4—Agricultural exports from Kenya, 1981-2000<br />
Average % of Average % of Average % of Average % of<br />
1981-83 Total 1990-92 Total 1994-96 Total 98-2000 Total<br />
Population (million) 17.9 24.0 26.7 29.4<br />
GDP (constant 1995 US$, million) 5908.2 8418.0 9362.0 9849.8<br />
GDP per capita (constant 1995 US$) 330.1 350.5 350.8 334.9<br />
GDP growth (annual percent) -- 4.0 2.7 1.3<br />
Exports (constant 1995 US$, million) 1516.2 2479.4 3074.7 2792.9<br />
Percent of exports in GDP<br />
Agricultural value-added<br />
25.7 29.5 32.8 28.4<br />
(constant 1995 US$, million)<br />
Percent of agricultural value-added in<br />
1856.1 2339.3 2382.9 2562.1<br />
GDP 31.4 27.8 25.5 26.0<br />
Agricultural Exports<br />
Value (real a million US$) 852.7 841.5 1251.2 1216.4<br />
Percent of GDP 14.4 10.0 13.4 12.3<br />
Percent of total exports 56.2 33.9 40.7 43.6<br />
Percent of SSA agricultural exports b 7.1 8.3 9.5 9.4<br />
Traditional (real a million US$) 613.3 71.9 533.9 63.4 736.3 58.9 768.0 63.1<br />
Coffee 348.5 40.9 182.4 21.7 306.6 24.5 195.0 16.0<br />
Tea<br />
<strong>Food</strong> and animals<br />
229.6 26.9 322.0 38.3 387.5 31.0 533.5 43.9<br />
(real a million US$) 167.3 19.6 183.8 21.8 274.2 21.9 250.2 20.6<br />
Vegetables and fruits 104.1 12.2 120.1 14.3 148.9 11.9 174.9 14.4<br />
Sugar and honey<br />
Fish & fish products<br />
28.4 3.3 12.8 1.5 39.0 3.1 18.8 1.5<br />
(real a million US$) 2.9 0.3 30.4 3.6 45.8 3.7 32.9 2.7<br />
Others (real a million US$) 69.3 8.1 93.4 11.1 194.9 15.6 165.3 13.6<br />
Hides and skins 20.3 2.4 4.5 0.5 11.0 0.9 4.9 0.4<br />
Total (real a million US$) 852.7 100.0 841.5 100.0 1251.2 100.0 1216.4 100.0<br />
Source: World Development Indicators, World Bank, and FAOSTAT.<br />
a<br />
All values are deflated by U. S. wholesale price index (2000=100) obtained from <strong>International</strong> Financial<br />
Statistics, IMF.<br />
b<br />
SSA agricultural exports also include cut flowers, fish and fishery products. However, values of cut flower<br />
exports from Kenya, Zimbabwe, Zambia, Uganda, South Africa, Tanzania, Cote d'Ivoire, and Mauritius are<br />
added to obtain SSA countries' export of cut flowers.<br />
99