Market Opportunities for African Agriculture - International Food ...
Market Opportunities for African Agriculture - International Food ...
Market Opportunities for African Agriculture - International Food ...

Create successful ePaper yourself
Turn your PDF publications into a flip-book with our unique Google optimized e-Paper software.
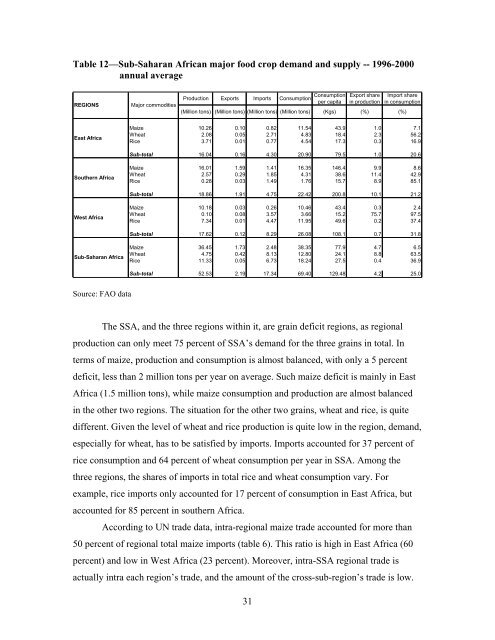
Table 12—Sub-Saharan <strong>African</strong> major food crop demand and supply -- 1996-2000<br />
annual average<br />
Production Exports Imports Consumption<br />
REGIONS Major commodities<br />
(Million tons) (Million tons) (Million tons) (Million tons)<br />
East Africa<br />
Southern Africa<br />
West Africa<br />
Sub-Saharan Africa<br />
Source: FAO data<br />
The SSA, and the three regions within it, are grain deficit regions, as regional<br />
production can only meet 75 percent of SSA’s demand <strong>for</strong> the three grains in total. In<br />
terms of maize, production and consumption is almost balanced, with only a 5 percent<br />
deficit, less than 2 million tons per year on average. Such maize deficit is mainly in East<br />
Africa (1.5 million tons), while maize consumption and production are almost balanced<br />
in the other two regions. The situation <strong>for</strong> the other two grains, wheat and rice, is quite<br />
different. Given the level of wheat and rice production is quite low in the region, demand,<br />
especially <strong>for</strong> wheat, has to be satisfied by imports. Imports accounted <strong>for</strong> 37 percent of<br />
rice consumption and 64 percent of wheat consumption per year in SSA. Among the<br />
three regions, the shares of imports in total rice and wheat consumption vary. For<br />
example, rice imports only accounted <strong>for</strong> 17 percent of consumption in East Africa, but<br />
accounted <strong>for</strong> 85 percent in southern Africa.<br />
According to UN trade data, intra-regional maize trade accounted <strong>for</strong> more than<br />
50 percent of regional total maize imports (table 6). This ratio is high in East Africa (60<br />
percent) and low in West Africa (23 percent). Moreover, intra-SSA regional trade is<br />
actually intra each region’s trade, and the amount of the cross-sub-region’s trade is low.<br />
31<br />
Consumption Export share Import share<br />
per capita in production in consumption<br />
(Kgs)<br />
(%)<br />
(%)<br />
Maize 10.26 0.10 0.82 11.54 43.9 1.0 7.1<br />
Wheat 2.08 0.05 2.71 4.83 18.4 2.3 56.2<br />
Rice 3.71 0.01 0.77 4.54 17.3 0.3 16.9<br />
Sub-total 16.04 0.16 4.30 20.90 79.5 1.0 20.6<br />
Maize 16.01 1.59 1.41 16.35 146.4 9.9 8.6<br />
Wheat 2.57 0.29 1.85 4.31 38.6 11.4 42.9<br />
Rice 0.28 0.03 1.49 1.76 15.7 8.9 85.1<br />
Sub-total 18.86 1.91 4.75 22.42 200.8 10.1 21.2<br />
Maize 10.18 0.03 0.26 10.46 43.4 0.3 2.4<br />
Wheat 0.10 0.08 3.57 3.66 15.2 75.7 97.5<br />
Rice 7.34 0.01 4.47 11.95 49.6 0.2 37.4<br />
Sub-total 17.62 0.12 8.29 26.08 108.1 0.7 31.8<br />
Maize 36.45 1.73 2.48 38.35 77.9 4.7 6.5<br />
Wheat 4.75 0.42 8.13 12.80 24.1 8.8 63.5<br />
Rice 11.33 0.05 6.73 18.24 27.5 0.4 36.9<br />
Sub-total 52.53 2.19 17.34 69.40 129.48 4.2 25.0