Market Opportunities for African Agriculture - International Food ...
Market Opportunities for African Agriculture - International Food ...
Market Opportunities for African Agriculture - International Food ...

You also want an ePaper? Increase the reach of your titles
YUMPU automatically turns print PDFs into web optimized ePapers that Google loves.
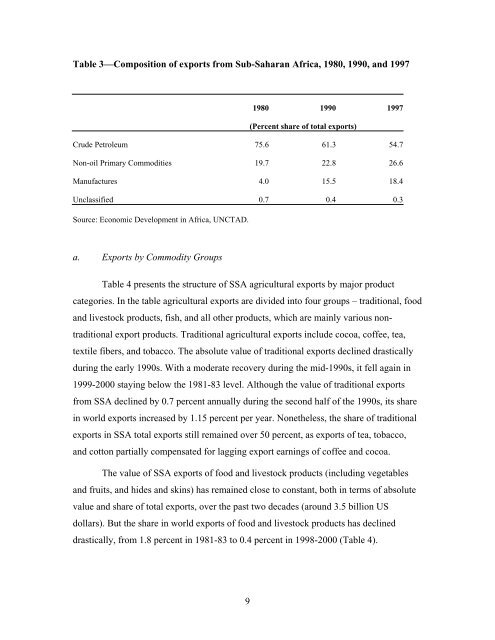
Table 3—Composition of exports from Sub-Saharan Africa, 1980, 1990, and 1997<br />
9<br />
1980 1990 1997<br />
(Percent share of total exports)<br />
Crude Petroleum 75.6 61.3 54.7<br />
Non-oil Primary Commodities 19.7 22.8 26.6<br />
Manufactures 4.0 15.5 18.4<br />
Unclassified 0.7 0.4 0.3<br />
Source: Economic Development in Africa, UNCTAD.<br />
a. Exports by Commodity Groups<br />
Table 4 presents the structure of SSA agricultural exports by major product<br />
categories. In the table agricultural exports are divided into four groups – traditional, food<br />
and livestock products, fish, and all other products, which are mainly various nontraditional<br />
export products. Traditional agricultural exports include cocoa, coffee, tea,<br />
textile fibers, and tobacco. The absolute value of traditional exports declined drastically<br />
during the early 1990s. With a moderate recovery during the mid-1990s, it fell again in<br />
1999-2000 staying below the 1981-83 level. Although the value of traditional exports<br />
from SSA declined by 0.7 percent annually during the second half of the 1990s, its share<br />
in world exports increased by 1.15 percent per year. Nonetheless, the share of traditional<br />
exports in SSA total exports still remained over 50 percent, as exports of tea, tobacco,<br />
and cotton partially compensated <strong>for</strong> lagging export earnings of coffee and cocoa.<br />
The value of SSA exports of food and livestock products (including vegetables<br />
and fruits, and hides and skins) has remained close to constant, both in terms of absolute<br />
value and share of total exports, over the past two decades (around 3.5 billion US<br />
dollars). But the share in world exports of food and livestock products has declined<br />
drastically, from 1.8 percent in 1981-83 to 0.4 percent in 1998-2000 (Table 4).