CITY OF GREATER GEELONG 2012-2013 Rating StRategy
CITY OF GREATER GEELONG 2012-2013 Rating StRategy
CITY OF GREATER GEELONG 2012-2013 Rating StRategy

Create successful ePaper yourself
Turn your PDF publications into a flip-book with our unique Google optimized e-Paper software.
Row Labels<br />
No. of<br />
Properties<br />
Sum of<br />
2010 Current CIV<br />
Sum of<br />
<strong>2012</strong> Reval CIV<br />
% Change<br />
<strong>2012</strong> from 2010<br />
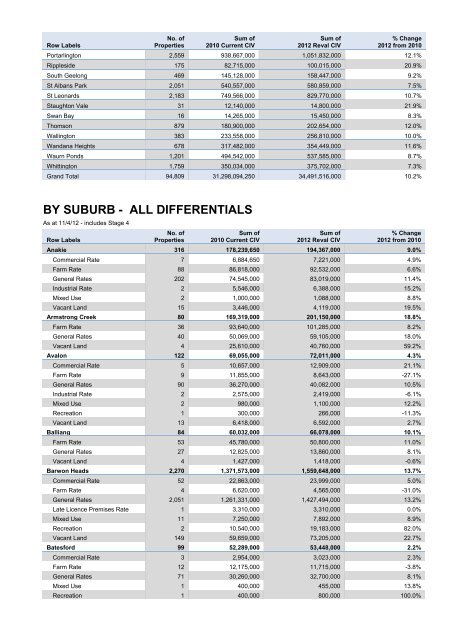
Portarlington 2,559 938,667,000 1,051,832,000 12.1%<br />
Rippleside 175 82,715,000 100,015,000 20.9%<br />
South Geelong 469 145,128,000 158,447,000 9.2%<br />
St Albans Park 2,051 540,557,000 580,859,000 7.5%<br />
St Leonards 2,183 749,566,000 829,770,000 10.7%<br />
Staughton Vale 31 12,140,000 14,800,000 21.9%<br />
Swan Bay 16 14,265,000 15,450,000 8.3%<br />
Thomson 879 180,900,000 202,654,000 12.0%<br />
Wallington 383 233,558,000 256,810,000 10.0%<br />
Wandana Heights 678 317,482,000 354,449,000 11.6%<br />
Waurn Ponds 1,201 494,542,000 537,585,000 8.7%<br />
Whittington 1,759 350,034,000 375,702,000 7.3%<br />
Grand Total 94,809 31,298,094,250 34,491,516,000 10.2%<br />
BY SUBURB - ALL DIFFERENTIALS<br />
As at 11/4/12 - includes Stage 4<br />
Row Labels<br />
No. of<br />
Properties<br />
Sum of<br />
2010 Current CIV<br />
Sum of<br />
<strong>2012</strong> Reval CIV<br />
% Change<br />
<strong>2012</strong> from 2010<br />
Anakie 316 178,239,650 194,367,000 9.0%<br />
Commercial Rate 7 6,884,650 7,221,000 4.9%<br />
Farm Rate 88 86,818,000 92,532,000 6.6%<br />
General Rates 202 74,545,000 83,019,000 11.4%<br />
Industrial Rate 2 5,546,000 6,388,000 15.2%<br />
Mixed Use 2 1,000,000 1,088,000 8.8%<br />
Vacant Land 15 3,446,000 4,119,000 19.5%<br />
Armstrong Creek 80 169,319,000 201,150,000 18.8%<br />
Farm Rate 36 93,640,000 101,285,000 8.2%<br />
General Rates 40 50,069,000 59,105,000 18.0%<br />
Vacant Land 4 25,610,000 40,760,000 59.2%<br />
Avalon 122 69,055,000 72,011,000 4.3%<br />
Commercial Rate 5 10,657,000 12,909,000 21.1%<br />
Farm Rate 9 11,855,000 8,643,000 -27.1%<br />
General Rates 90 36,270,000 40,082,000 10.5%<br />
Industrial Rate 2 2,575,000 2,419,000 -6.1%<br />
Mixed Use 2 980,000 1,100,000 12.2%<br />
Recreation 1 300,000 266,000 -11.3%<br />
Vacant Land 13 6,418,000 6,592,000 2.7%<br />
Balliang 84 60,032,000 66,078,000 10.1%<br />
Farm Rate 53 45,780,000 50,800,000 11.0%<br />
General Rates 27 12,825,000 13,860,000 8.1%<br />
Vacant Land 4 1,427,000 1,418,000 -0.6%<br />
Barwon Heads 2,270 1,371,573,000 1,559,648,000 13.7%<br />
Commercial Rate 52 22,863,000 23,999,000 5.0%<br />
Farm Rate 4 6,620,000 4,565,000 -31.0%<br />
General Rates 2,051 1,261,331,000 1,427,494,000 13.2%<br />
Late Licence Premises Rate 1 3,310,000 3,310,000 0.0%<br />
Mixed Use 11 7,250,000 7,892,000 8.9%<br />
Recreation 2 10,540,000 19,183,000 82.0%<br />
Vacant Land 149 59,659,000 73,205,000 22.7%<br />
Batesford 99 52,289,000 53,448,000 2.2%<br />
Commercial Rate 3 2,954,000 3,023,000 2.3%<br />
Farm Rate 12 12,175,000 11,715,000 -3.8%<br />
General Rates 71 30,260,000 32,700,000 8.1%<br />
Mixed Use 1 400,000 455,000 13.8%<br />
Recreation 1 400,000 800,000 100.0%