Download Annual Report PDF - Heinz
Download Annual Report PDF - Heinz
Download Annual Report PDF - Heinz

Create successful ePaper yourself
Turn your PDF publications into a flip-book with our unique Google optimized e-Paper software.
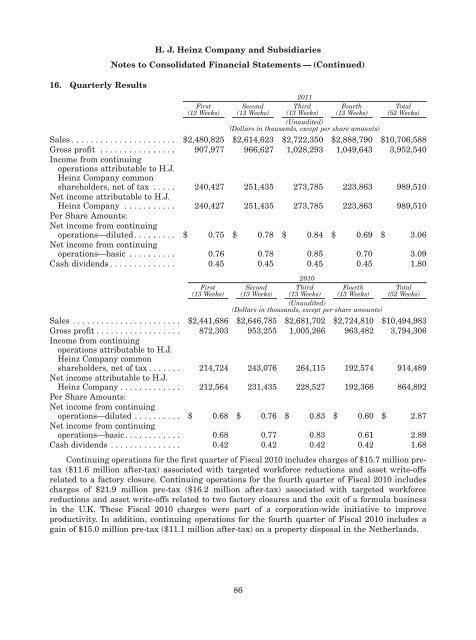
16. Quarterly Results<br />
H. J. <strong>Heinz</strong> Company and Subsidiaries<br />
Notes to Consolidated Financial Statements — (Continued)<br />
First<br />
(13 Weeks)<br />
Second<br />
(13 Weeks)<br />
2011<br />
Third<br />
(13 Weeks)<br />
Fourth<br />
(13 Weeks)<br />
Total<br />
(52 Weeks)<br />
(Unaudited)<br />
(Dollars in thousands, except per share amounts)<br />
Sales . . . . . . . . . . . . . . . . . . . . . . $2,480,825 $2,614,623 $2,722,350 $2,888,790 $10,706,588<br />
Gross profit . . . . . . . . . . . . . . . . 907,977 966,627 1,028,293 1,049,643 3,952,540<br />
Income from continuing<br />
operations attributable to H.J.<br />
<strong>Heinz</strong> Company common<br />
shareholders, net of tax . . . . . 240,427 251,435 273,785 223,863 989,510<br />
Net income attributable to H.J.<br />
<strong>Heinz</strong> Company . . . . . . . . . . . 240,427 251,435 273,785 223,863 989,510<br />
Per Share Amounts:<br />
Net income from continuing<br />
operations—diluted. . . . . . . . . $ 0.75 $ 0.78 $ 0.84 $ 0.69 $ 3.06<br />
Net income from continuing<br />
operations—basic . . . . . . . . . . 0.76 0.78 0.85 0.70 3.09<br />
Cash dividends . . . . . . . . . . . . . . 0.45 0.45 0.45 0.45 1.80<br />
First<br />
(13 Weeks)<br />
Second<br />
(13 Weeks)<br />
2010<br />
Third<br />
(13 Weeks)<br />
Fourth<br />
(13 Weeks)<br />
Total<br />
(52 Weeks)<br />
(Unaudited)<br />
(Dollars in thousands, except per share amounts)<br />
Sales . . . . . . . . . . . . . . . . . . . . . . . $2,441,686 $2,646,785 $2,681,702 $2,724,810 $10,494,983<br />
Gross profit . . . . . . . . . . . . . . . . . . 872,303 953,255 1,005,266 963,482 3,794,306<br />
Income from continuing<br />
operations attributable to H.J.<br />
<strong>Heinz</strong> Company common<br />
shareholders, net of tax . . . . . . . 214,724 243,076 264,115 192,574 914,489<br />
Net income attributable to H.J.<br />
<strong>Heinz</strong> Company . . . . . . . . . . . . . 212,564 231,435 228,527 192,366 864,892<br />
Per Share Amounts:<br />
Net income from continuing<br />
operations—diluted . . . . . . . . . . $ 0.68 $ 0.76 $ 0.83 $ 0.60 $ 2.87<br />
Net income from continuing<br />
operations—basic . . . . . . . . . . . . 0.68 0.77 0.83 0.61 2.89<br />
Cash dividends . . . . . . . . . . . . . . . 0.42 0.42 0.42 0.42 1.68<br />
Continuing operations for the first quarter of Fiscal 2010 includes charges of $15.7 million pretax<br />
($11.6 million after-tax) associated with targeted workforce reductions and asset write-offs<br />
related to a factory closure. Continuing operations for the fourth quarter of Fiscal 2010 includes<br />
charges of $21.9 million pre-tax ($16.2 million after-tax) associated with targeted workforce<br />
reductions and asset write-offs related to two factory closures and the exit of a formula business<br />
in the U.K. These Fiscal 2010 charges were part of a corporation-wide initiative to improve<br />
productivity. In addition, continuing operations for the fourth quarter of Fiscal 2010 includes a<br />
gain of $15.0 million pre-tax ($11.1 million after-tax) on a property disposal in the Netherlands.<br />
86